May 10th Recap as well as May 11th Predictions
What to Expect in Today’s NASDAQ Analysis
With the seventh trading day of May completed, let us see how the day unfolded and what to expect tomorrow.
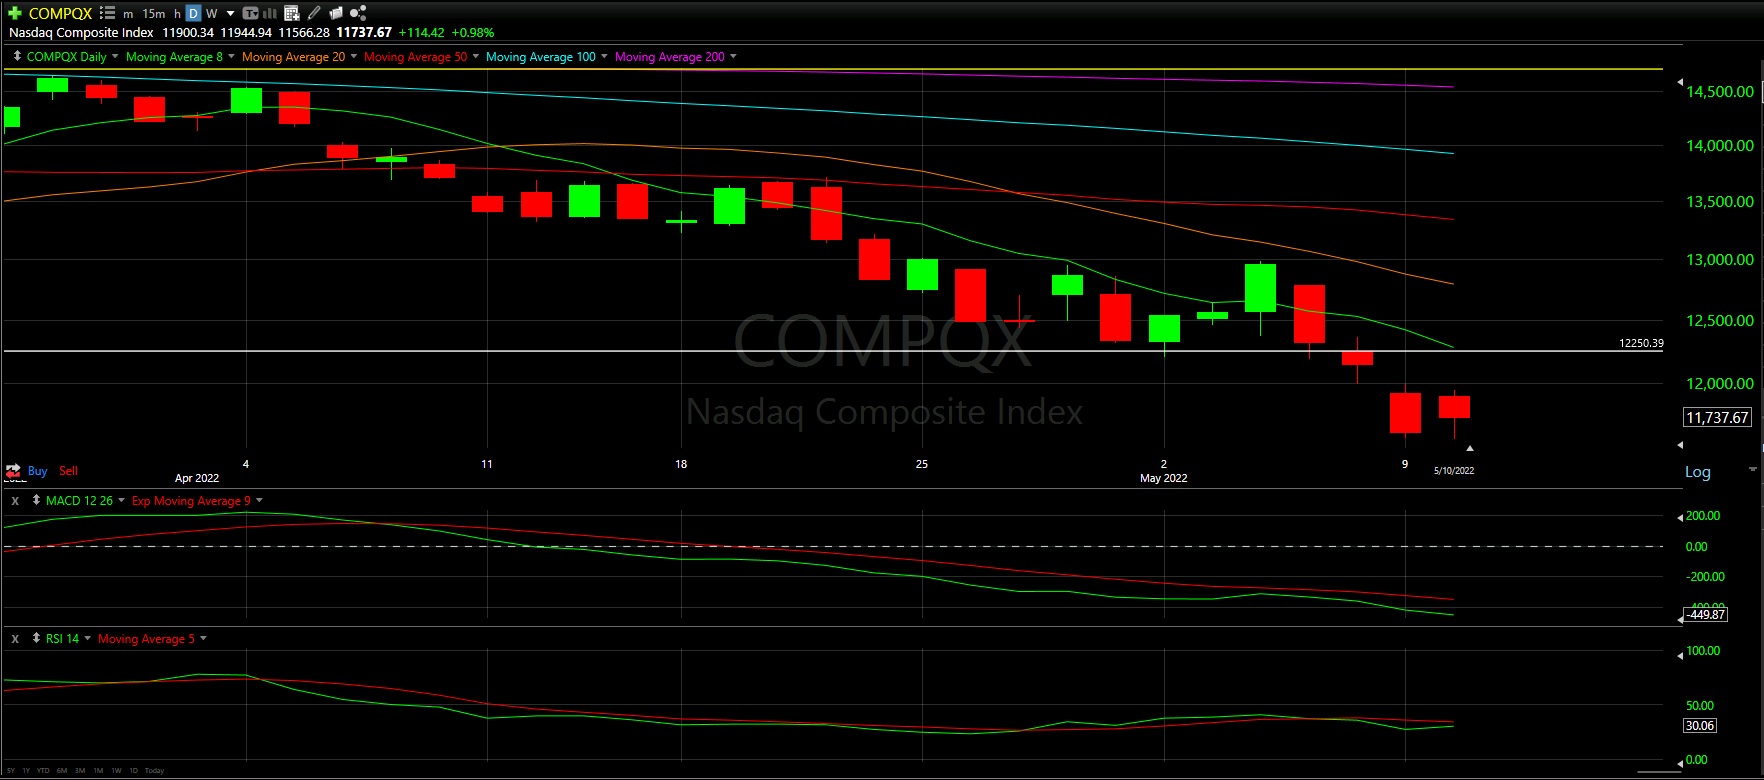
Above you will see the full view of the Daily chart; Top and Bottom indicators included.
As always, we will start by analyzing the Top Half of the Daily chart; seeing how our horizontal Support and Resistance Lines played out during the day, reviewing the Moving Averages that came into play as well as comparing previous candles.
From there, we will analyze the Bottom Half of the Daily chart to see what the momentum looks like going into tomorrow with the additional MACD and RSI indicators.
Ultimately, we will use the combined data to help anticipate the movement of the NASDAQ for tomorrow.
Top Half Analysis
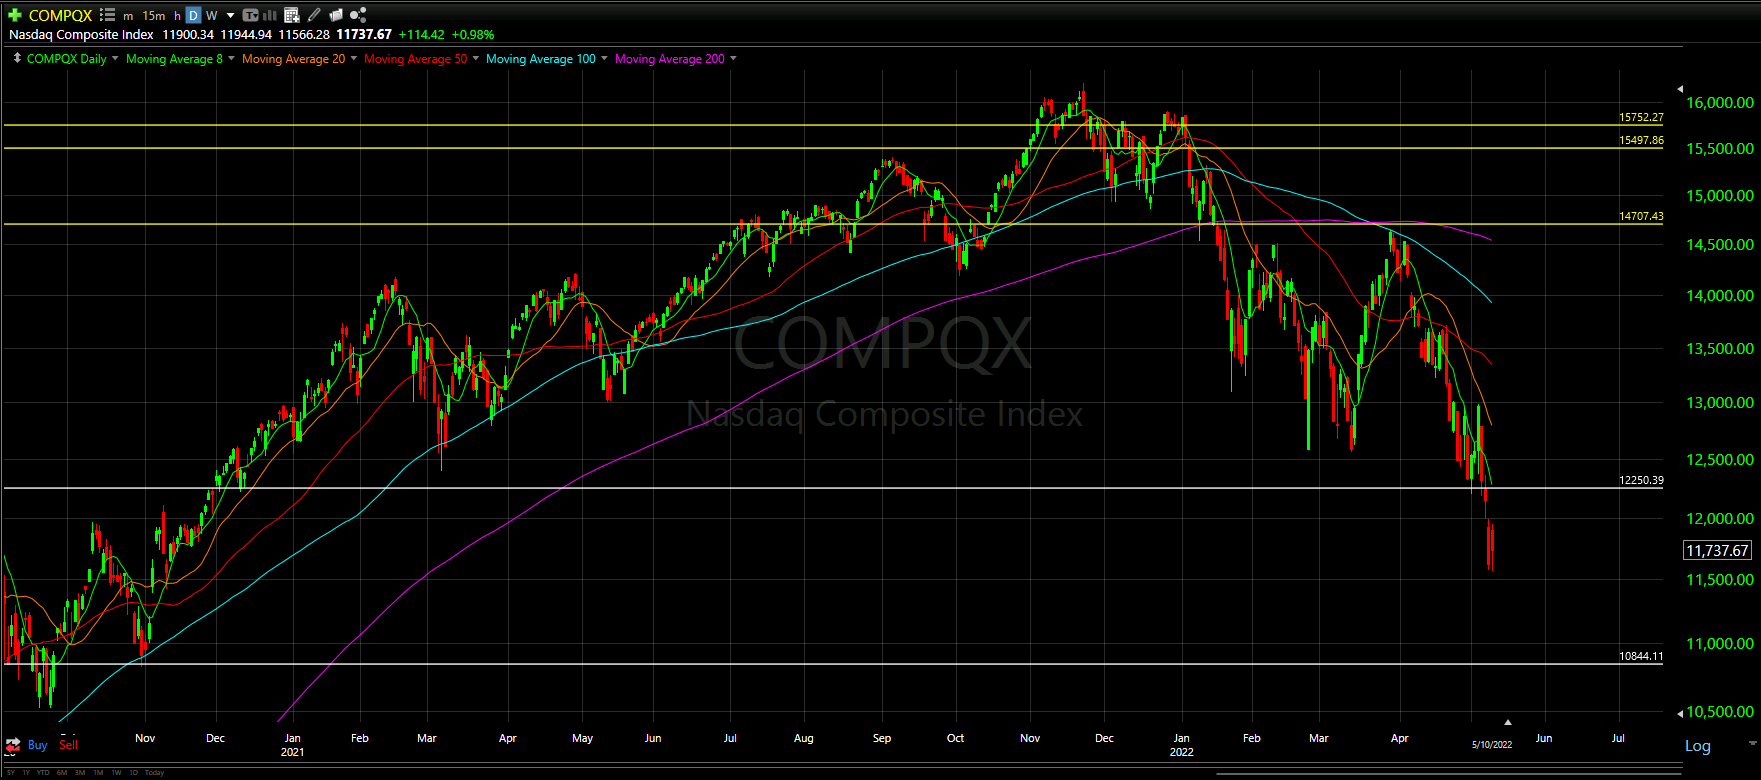
As mentioned yesterday, today we are taking a zoomed out view of the Top Half so we can start to see where we sit in comparison to the next Support Line down at roughly $10.8k; nearly a 10% gap between the previous $12.2k Support Line we just lost.
With this zoomed out view, the Moving Average lines really emphasize their respected slopes - most being in a very hard downward direction.
Even the longer term lines - the 100 and 200 MAs - are starting to show a prominent curve down. …Like a giant whale making a turn, once the direction is initiated, it takes a lot to get that momentum to turn around.
Ultimately, it seems very likely we will continue down to that $10.8k line. There may be some minor Support Lines that can be created given the rather large gap; however, those would provide minimal cushion to the drop.
Bottom Half Analysis
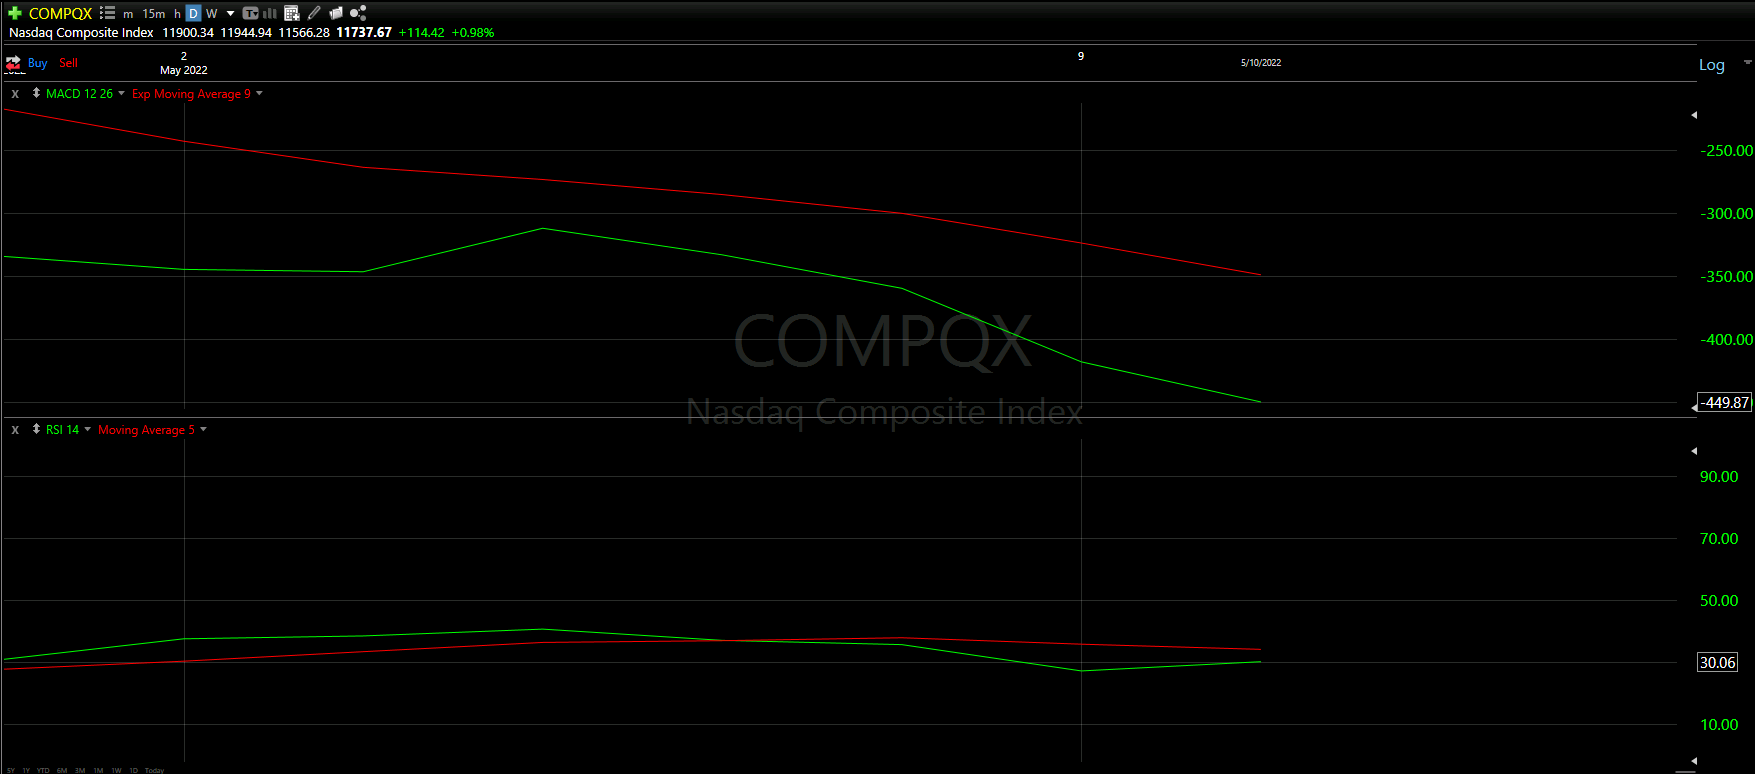
The goal of the Bottom Half analysis is to see a similar story between the MACD and RSI indicators. Ideally both are doing the thing, adding to the confidence of the readings.
Continuing the trend, we see the MACD and RSI Indicators both showing the Red line over the Green line.
Though the MACD continues to struggle, the RSI is trying to curve up a bit. Will there be a momentary overtake? We should know in the next day or two.
With neither green line over the red line, there is really nothing positive showing in the Bottom Half analysis. Expecting more of the same, for now at least.
Hourly Analysis
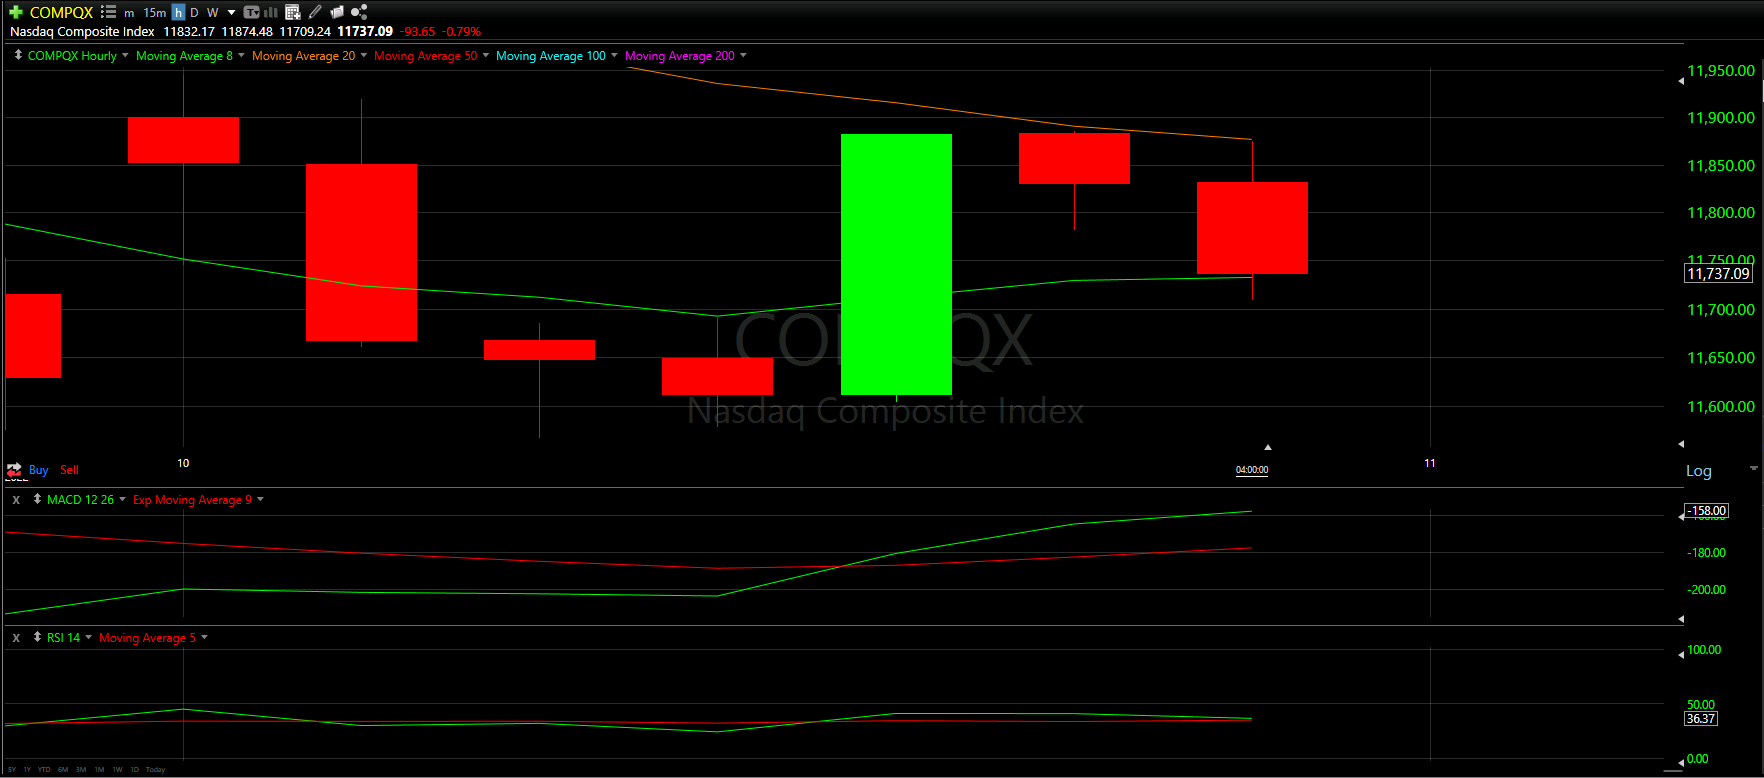
The day started out decent for the NASDAQ, with the first hour opening above the 8 Moving Average line.
The positivity was quickly squashed as the 2nd hour really drove down a lot of hope. In a quick 60 minutes, the Dow lost 50% of the first hour’s candle as well as the 8MA. Nothing got better the next hours as we seemingly headed for another horrible day.
The 5th hour really came to save the day - across all the Major Markets. We quickly regained most of the previous hourly loses, regaining the 8MA and giving the day a chance!
The day ended up somewhat lackluster; however, without that 5th hour, it easily could have been another horrible bloodbath.
Final Thoughts and Targets
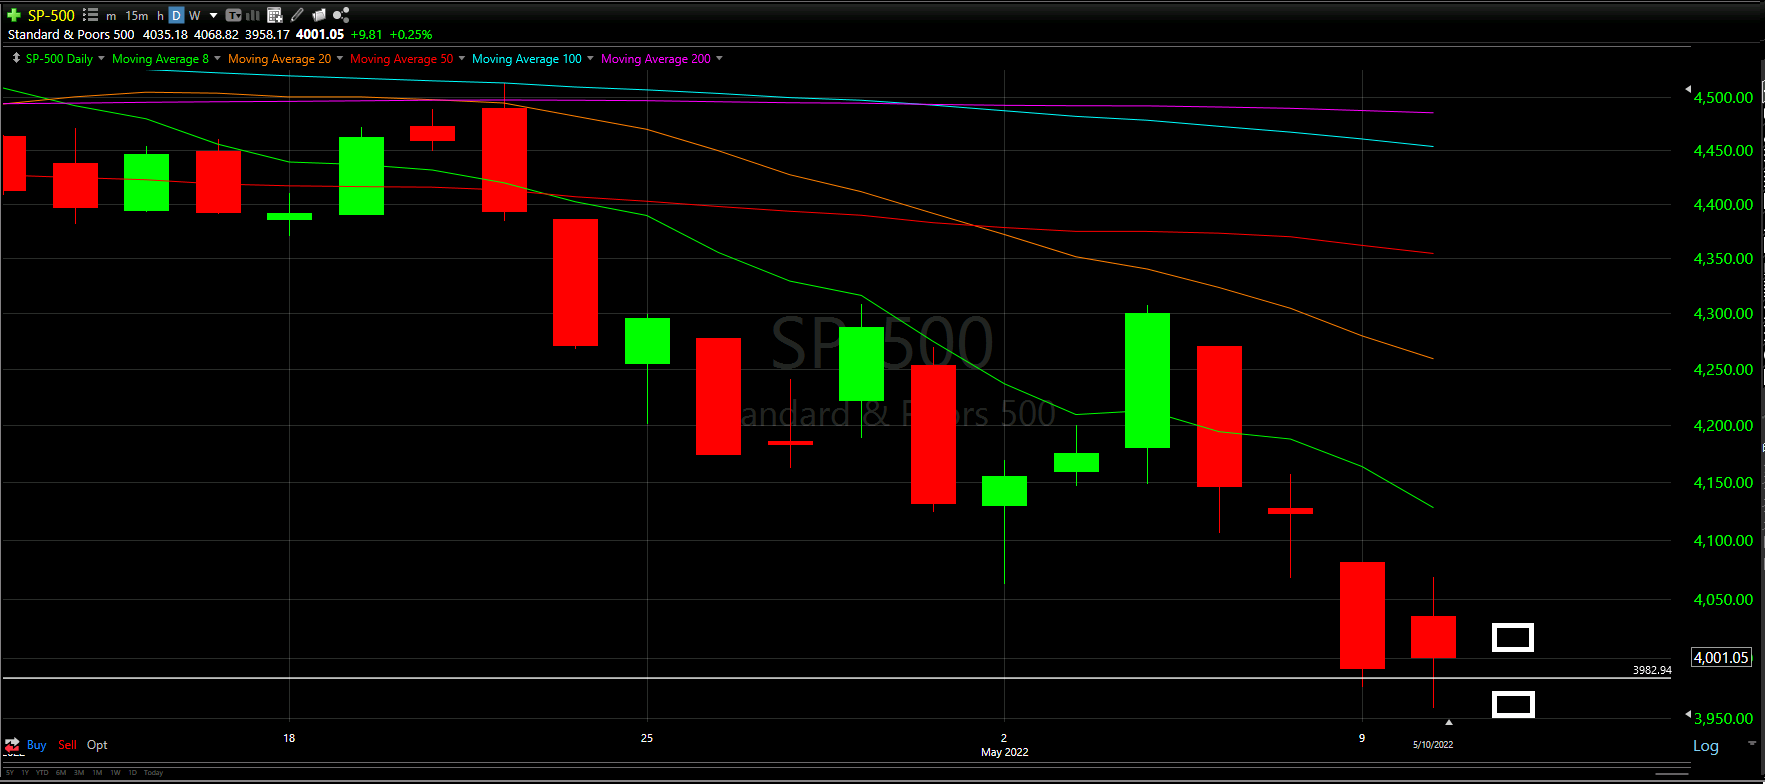
The only real hope for tomorrow comes from the S&P-500.
Ideally the Support Line is strong enough to propel this upward, and the correlation is strong enough to help the Dow Jones and NASDAQ
Best case scenario, close at or above 50% of today’s candle. Worst case, is keep dropping and lose this Support Line like the rest.
All the Majors continue trading well below the 8 Moving Average.
No reason to expect any positivity in the Market sustaining (for now).
Good luck trading!
Don’t forget to check out the Free Knowledge Center to refresh the basics or learn more about Technical or Fundamental Analysis