January 4th Recap and 5th Predictions

What to Expect in this Analysis
With the second trading day of January completed, let us see how the day played out and what to expect tomorrow.
As we will always do, the first thing to be reviewed will be Top Half of the Daily chart. We will see how the horizontal Support and Resistance Lines played out during the first day, as well as review the Moving Averages that came into play.
From there, we will look at the Bottom Half of the Daily chart to see what the momentum looks like going into tomorrow with the additional MACD and RSI indicators.
Overall, what we predicted yesterday seemed to have played out as we will see below
Top Half Analysis
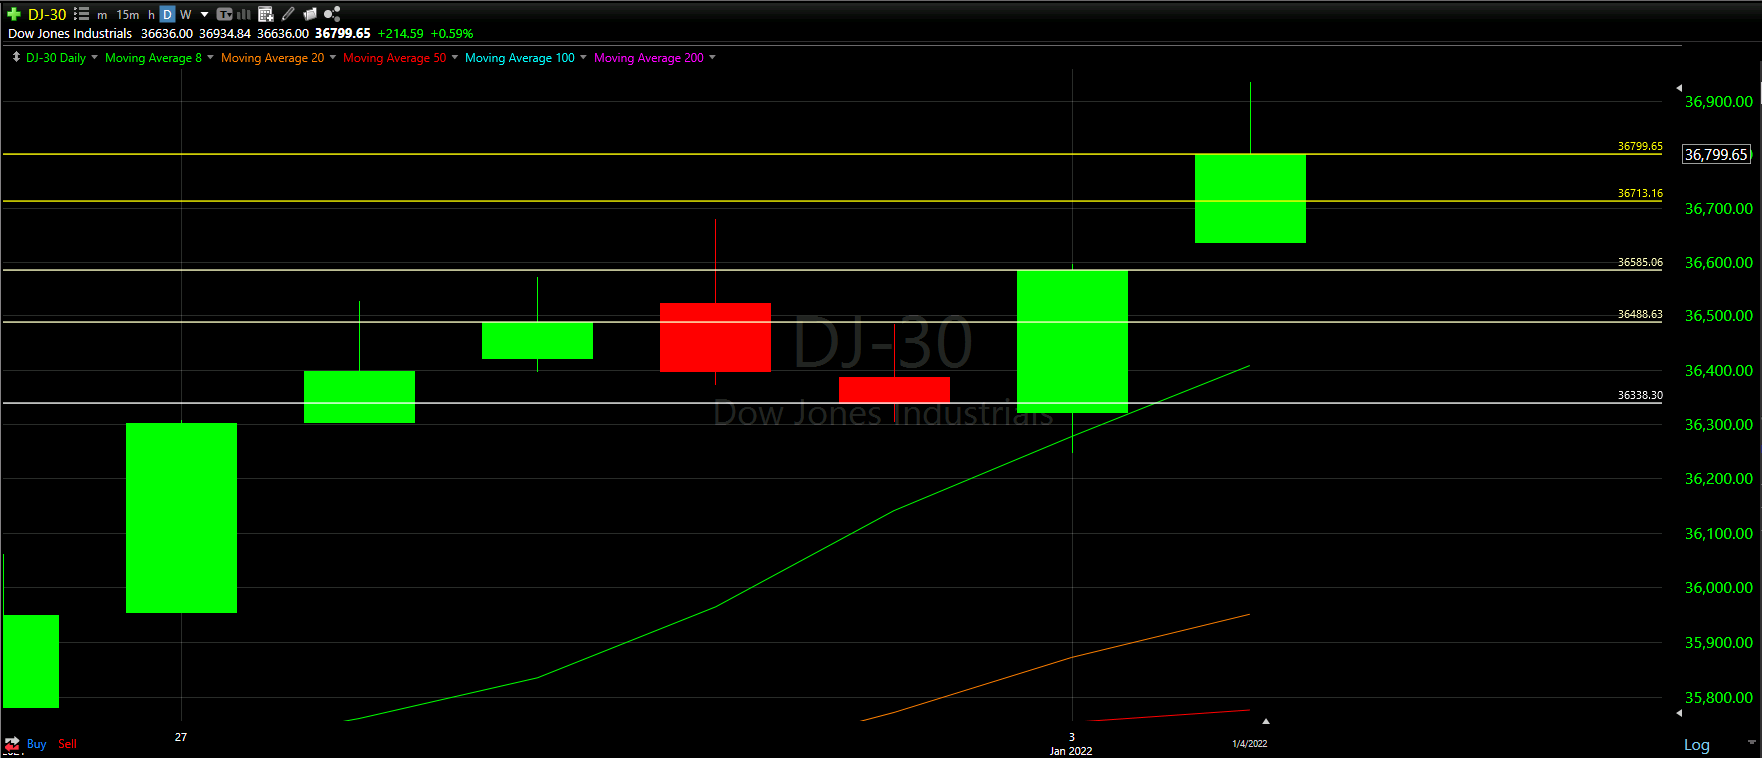
It was fantastic to see the Dow Jones open and close above both our the additional support lines we created yesterday. As a result we will do the exact same thing today.
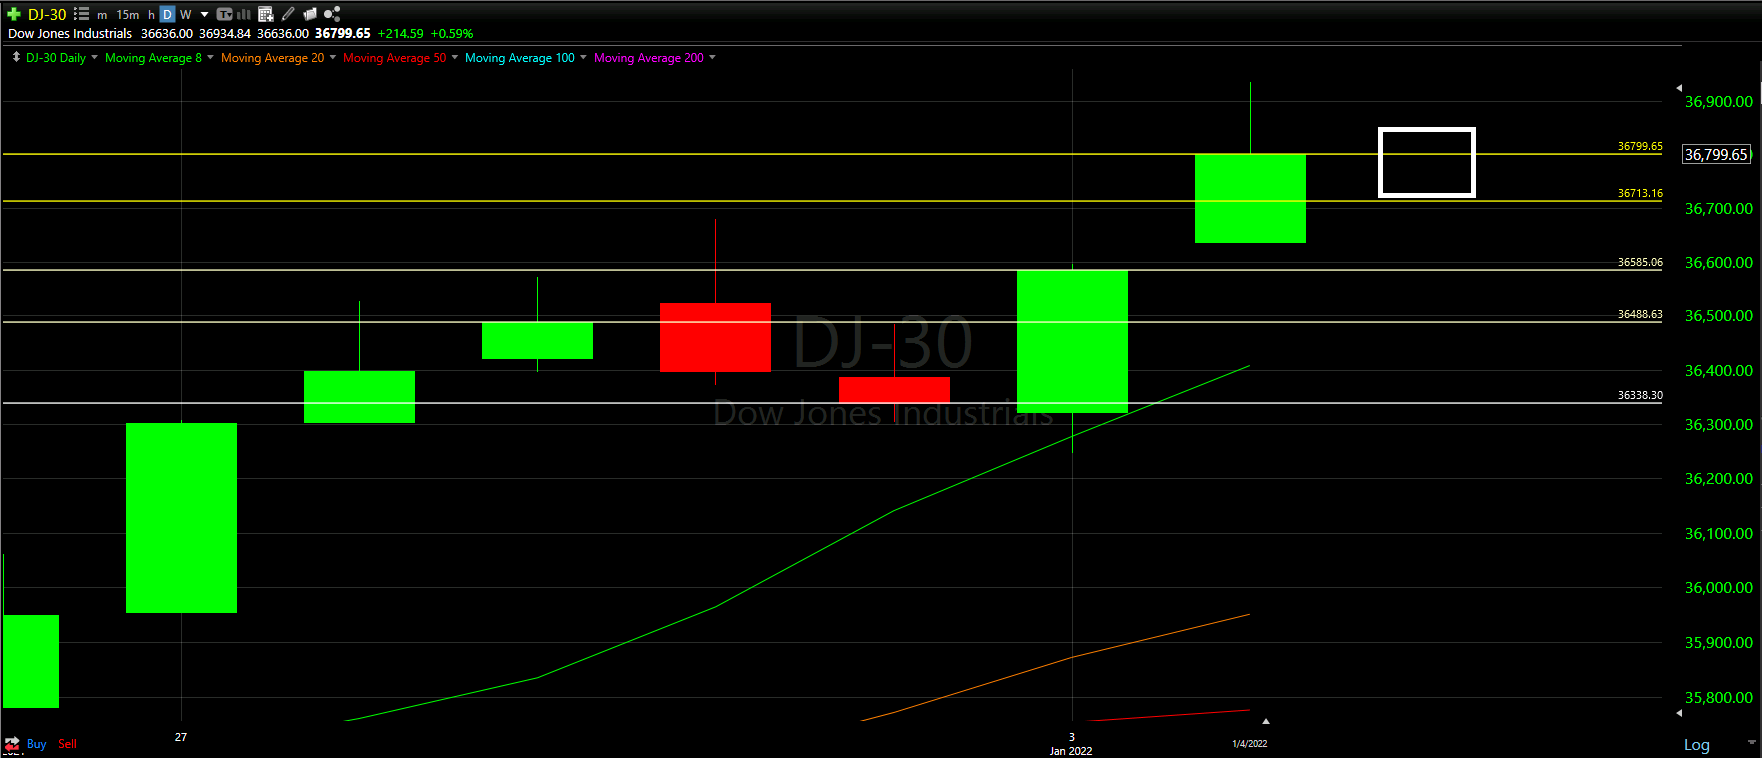
As you will see, there are 2 new Yellow Support lines that we created based on the 1/4/22 candle. We took the top and the middle to set our lines and help gauge what tomorrow might bring. The yellow lines created yesterday as well as the original lines created during the January Monthly Prediction have not been deleted. The candles are still close enough and the lines are still new enough that they may come into play in the next days or weeks.
We continue to trade well above the 8 Moving Average line and created a nice gap-up from yesterday; both a positive sign. The only negative worth noting is the fact that the daily candle had a rather large wick on top. That means it tried to keep climbing higher; however, something caused a drop that was never recovered. This can be a forewarning that attempt at the top failed and a downtrend is coming. We will need to wait and see
Despite ending with a bit of caution; overall, the Top Half technical analysis of the Dow Jones has been positive. Let us see if this carries over to the Bottom Half technical analysis as we look at the momentum indicators.

Bottom Half Analysis
Starting with the MACD, the Green line continues to sit far above the Red line; the same trend we saw during the January Monthly Prediction.
Yesterday we commented that the the peak of the green line may be starting to bend in an upward direction; however, this does not seem to be the case today. There is no drastic drop by any means, but the climb up seems to have slowed down.
The same can be said about the RSI. The upward bend in the green line from yesterday seems to be flattening a bit.
This seems to be a rather neutral rating from the Bottom Half Analysis. Though we are still in a good place overall, there seems to be a bit of steam lost in the momentum. Tomorrow should be a telling sign.

Hourly Analysis
With a solid view of the daily chart, let us look at each of the day’s trading hours between 9:30 a.m. to 4 p.m. ET, or the 7 candles above.
The first hour of the trading day crushed it, gapping over the support line at the top of yesterday’s candle. From there the second hour seemed to confirm the climb with the positive close. However, this is where the long wick on the top was created. Someone got caught buying as high as $36,900.00
The third hour started the downtrend by closing below 50% of the previous candle. That trend followed for the next 2 hours.
There was a very solid attempt the last 2 hours - you can even see another long wick at the top of the last hour in red.
We close just above 50% of the 6th candle and just above the 8 Moving Average, but just barely.
Final Thoughts and Targets
Overall, there was a mixed review in the daily and hourly charts for the Dow Jones.
This is by no means the first bearish indicator; however, caution should be had. We MUST close above 50% of yesterday’s candle, otherwise we may have a small correction coming. With the NASDAQ having a rough day and big red candle, there is a chance the Dow Jones follows soon.
Good luck trading!