January 5th Recap and 6th Predictions
What to Expect in this Analysis
With the third trading day of January completed, let us see how the day played out and what to expect tomorrow.
As we will always do, the first thing to be reviewed will be Top Half of the Daily chart. We will see how the horizontal Support and Resistance Lines played out during the first day, as well as review the Moving Averages that came into play.
From there, we will look at the Bottom Half of the Daily chart to see what the momentum looks like going into tomorrow with the additional MACD and RSI indicators.
Overall, the caution advised was a pretty wise prediction.
Top Half Analysis
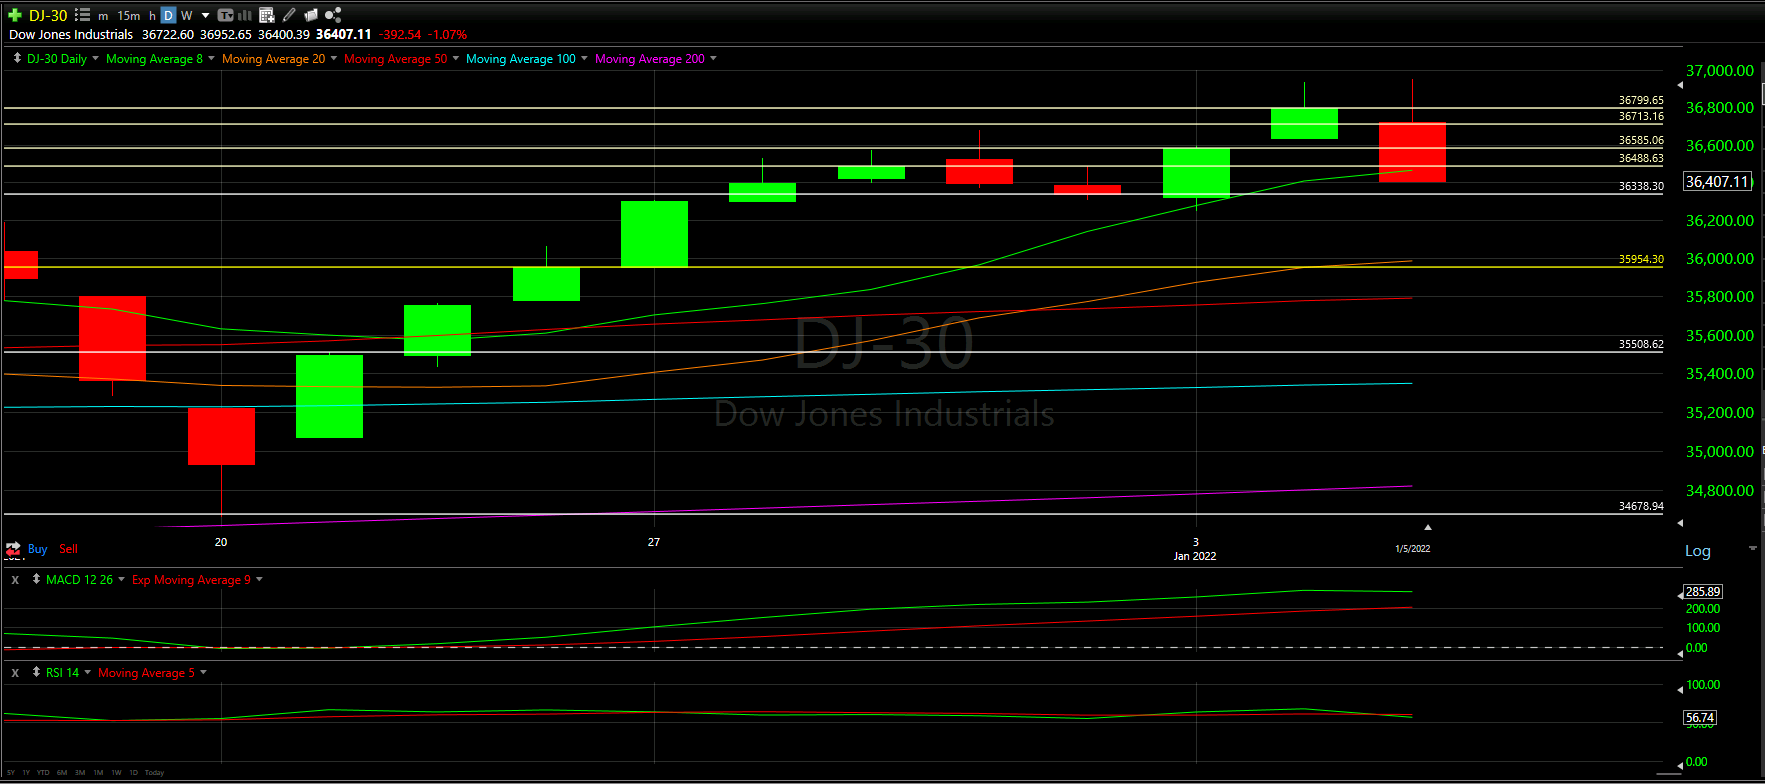
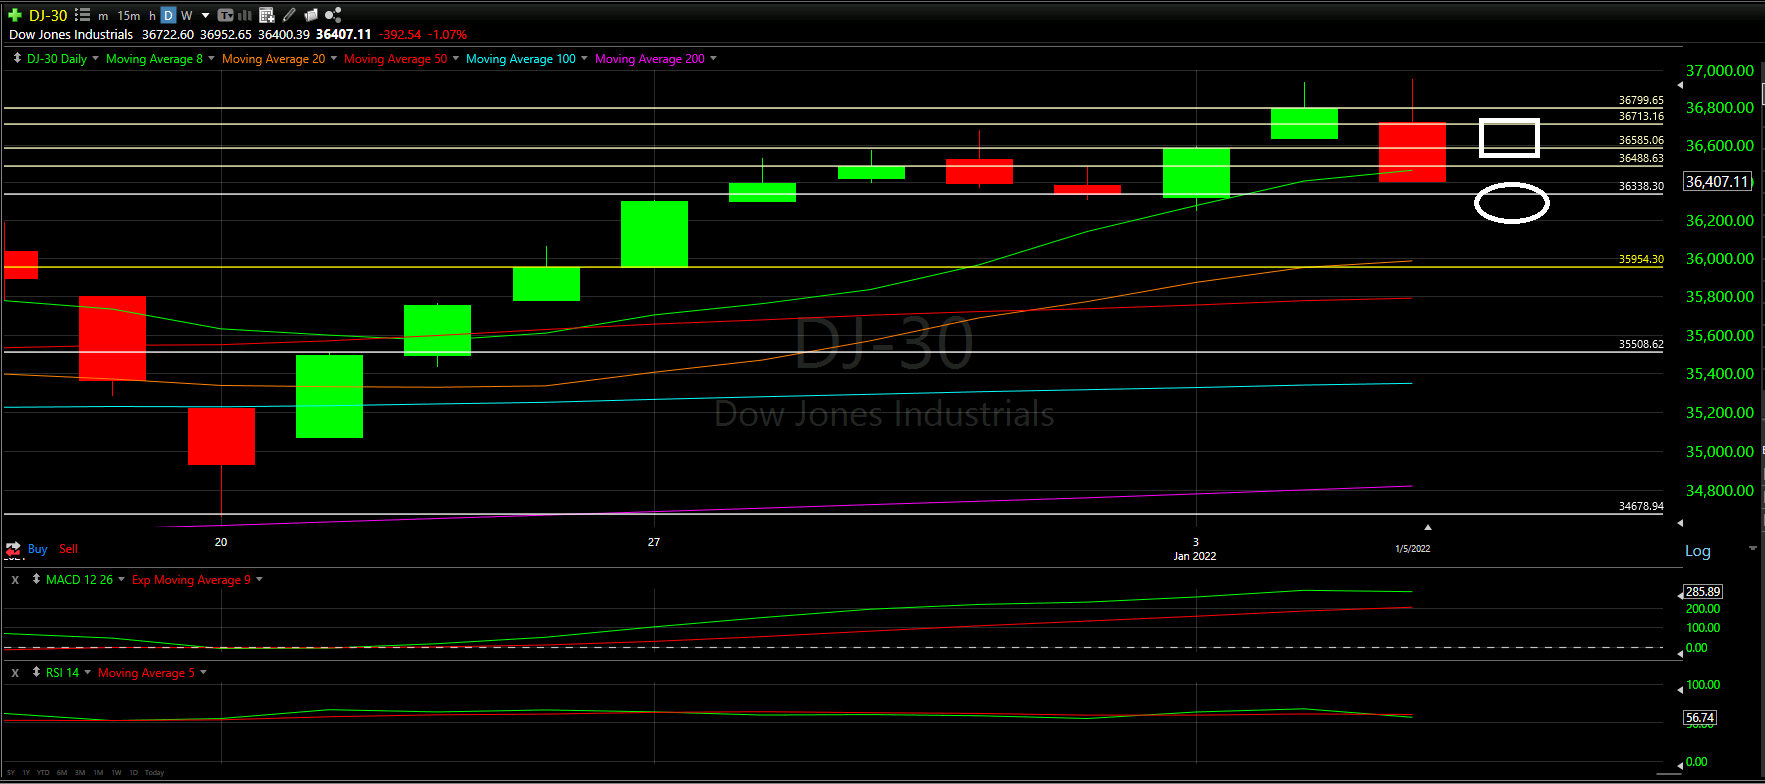
After 2 great days of trading for the Dow Jones, we get a hard drop as shown by the long red candle today. What adds some worry to this is the fact that the wick on top of the candle was rather large - someone got caught hoping for another good day
Today a number of negatives were seen including: losing 50% of yesterday’s candle, losing 4 support lines, and losing the 8 Moving Average.
Ouch!
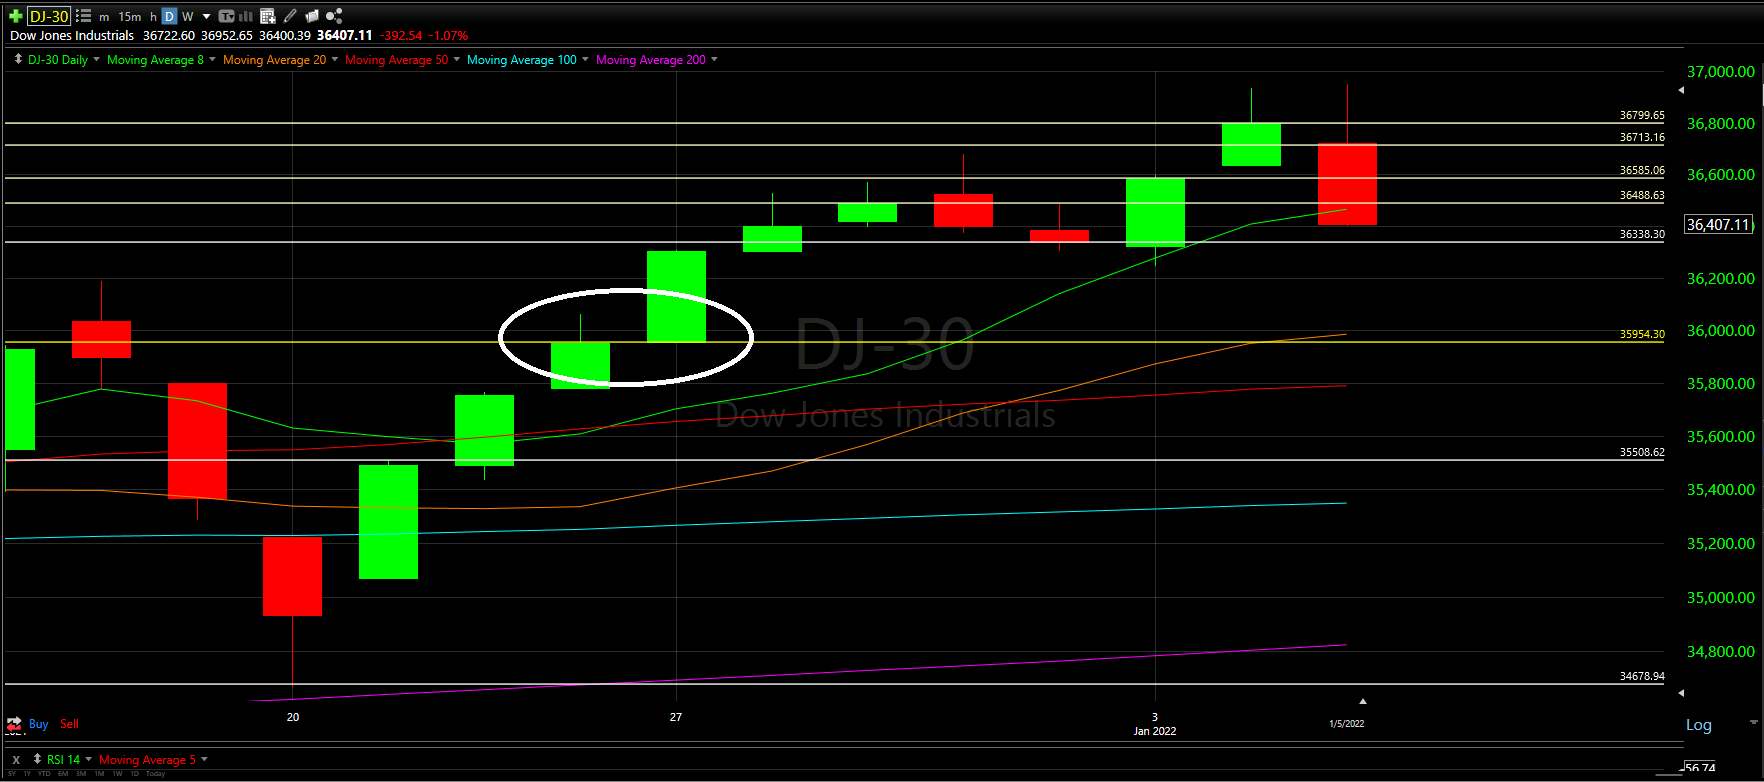
As a result a new horizontal Support in yellow was created based on the two candles on 12/26 and 12/27 - circled in the middle. This looks to line up with the 20 Moving Average as well so it adds a bit of confidence to the support line.
At this point, it seems we are losing this short-term uptrend and may be beginning a downtrend. Ideally this will be short lived.
As mentioned above, we have now lost the 8 Moving Average and closed below the line. This is always concerning, especially since this Top Half Analysis makes it seem like there is a bit more pain coming.
This was a rather negative Top Half Analysis and we really need to hope for some good news below
Bottom Half Analysis
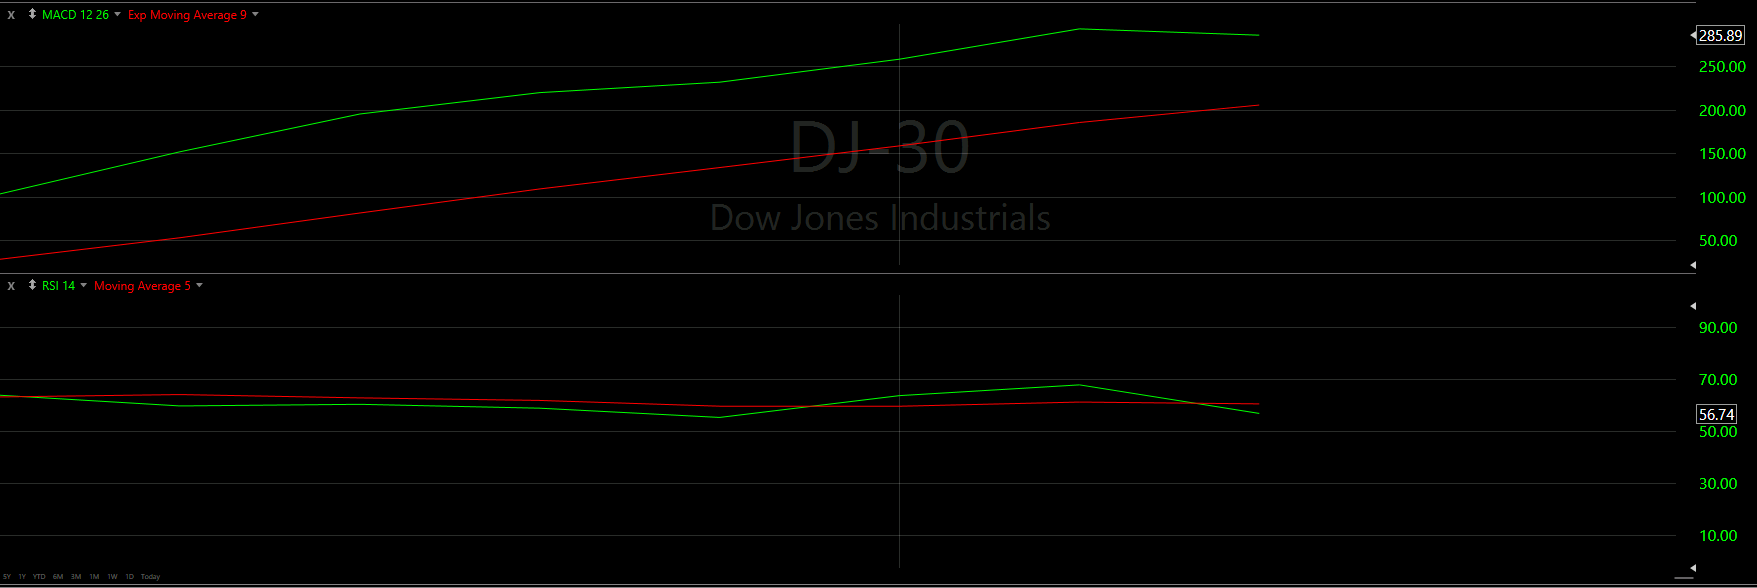
Starting with the MACD, our thoughts that the green line may lose the incline was validated today. It is evident that the Green and Red lines are starting to converge with each other. Unless we get some good news soon, we may have our first cross of the Red and Green lines. Never a good thing!
Unfortunately, the RSI’s Green line already had a rather sharp cross under the Red line. Momentum has already become negative with this indicator, and seems foreshadowing of the MACDs next couple days
Just like above, our Bottom Half Analysis brings a lot of concern to the Dow Jones tomorrow.
Hourly Analysis
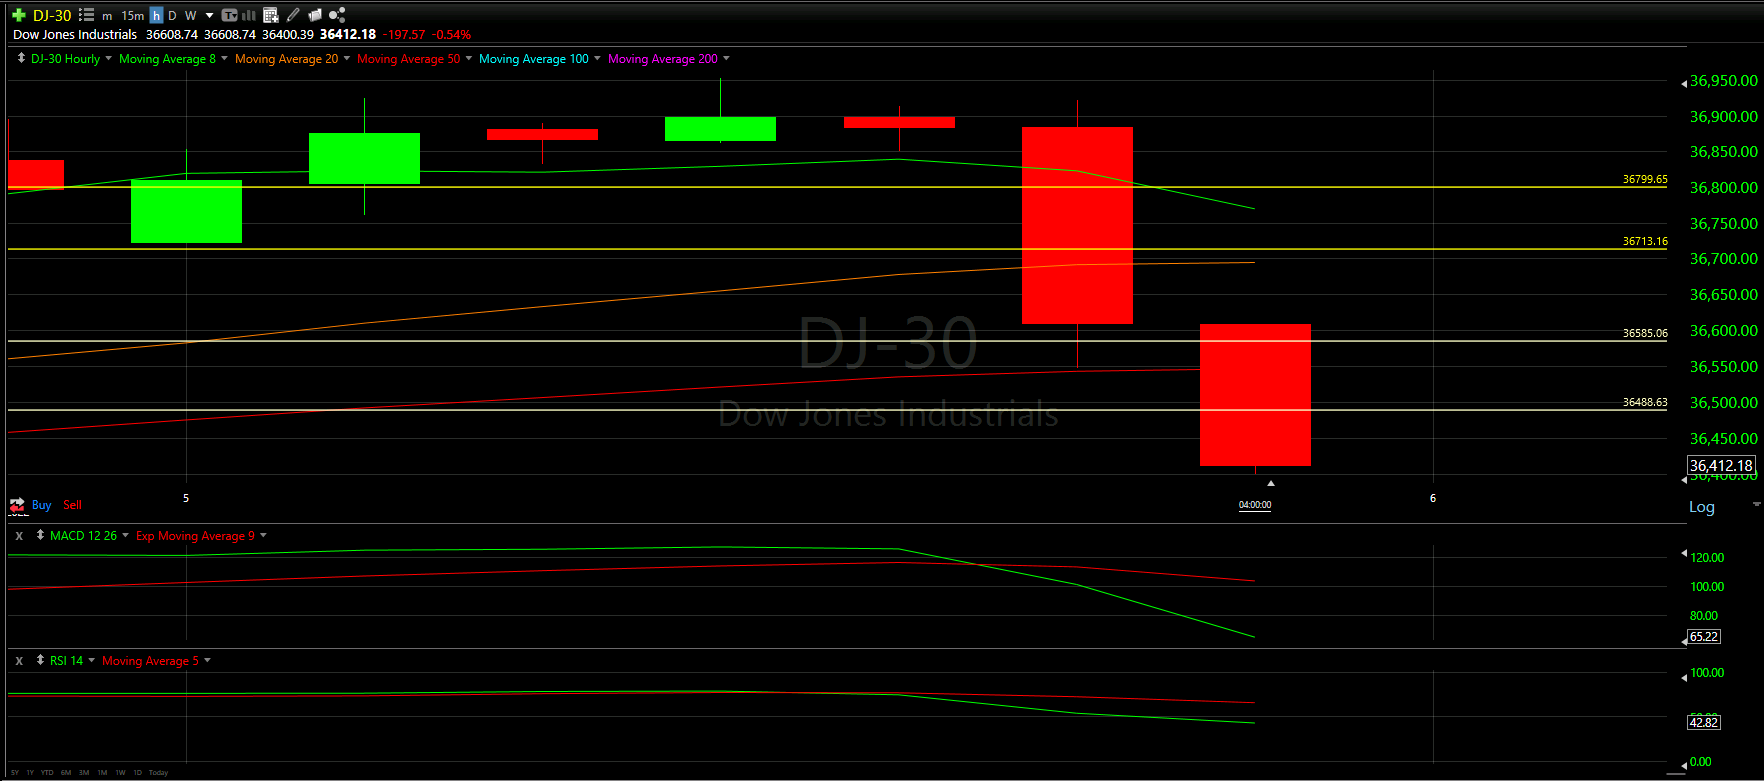
The hourly chart of the Dow Jones would have fooled most skilled traders.
The first 4 hours of trading (more than half the day) would be considered positive - 3 green candles and the only red candle never took 50% of the previous. Those 4 hours combined with the last 2 days of good trading would have implied more green coming.
However, our caution from yesterday came to fruition at the end of the day. In a short period of time 4 Support Lines and 3 Moving Averages were lost. That is hard to recover from and a very bad way to end the day.
Final Thoughts and Targets
It should be no surprise that we are worried about the Dow Jones - especially short term.
It seems we have lost our recent uptrend and may be starting to form a downtrend. Downtrends are not bad if they are short (or if you know they are coming and manage your money accordingly).
Best Case Scenario - we regain some support lines and close above the 8 Moving Average and 50% of yesterday’s candle. The White Rectangle above
Worst Case Scenario - now that we lose the 8 Moving Average, the candles move closer to the next Moving Average below (the 20)
Be careful out there tomorrow
Good luck trading!