May 3rd Recap as well as May 4th Predictions
What to Expect in the Analysis Below

With the second trading day of May completed, let us see how the day played out and what to expect tomorrow.
Above you will see the full view of the Daily chart, Top and Bottom Half indicators included.
As always, we will start by analyzing the Top Half of the Daily chart; seeing how our horizontal Support and Resistance Lines played out during the day, reviewing the Moving Averages that came into play as well as comparing previous candles.
From there, we will analyze the Bottom Half of the Daily chart to see what the momentum looks like going into tomorrow with the additional MACD and RSI indicators.
Ultimately, we will use the combined data to help predict the movement of the Dow Jones for tomorrow.
Top Half Analysis
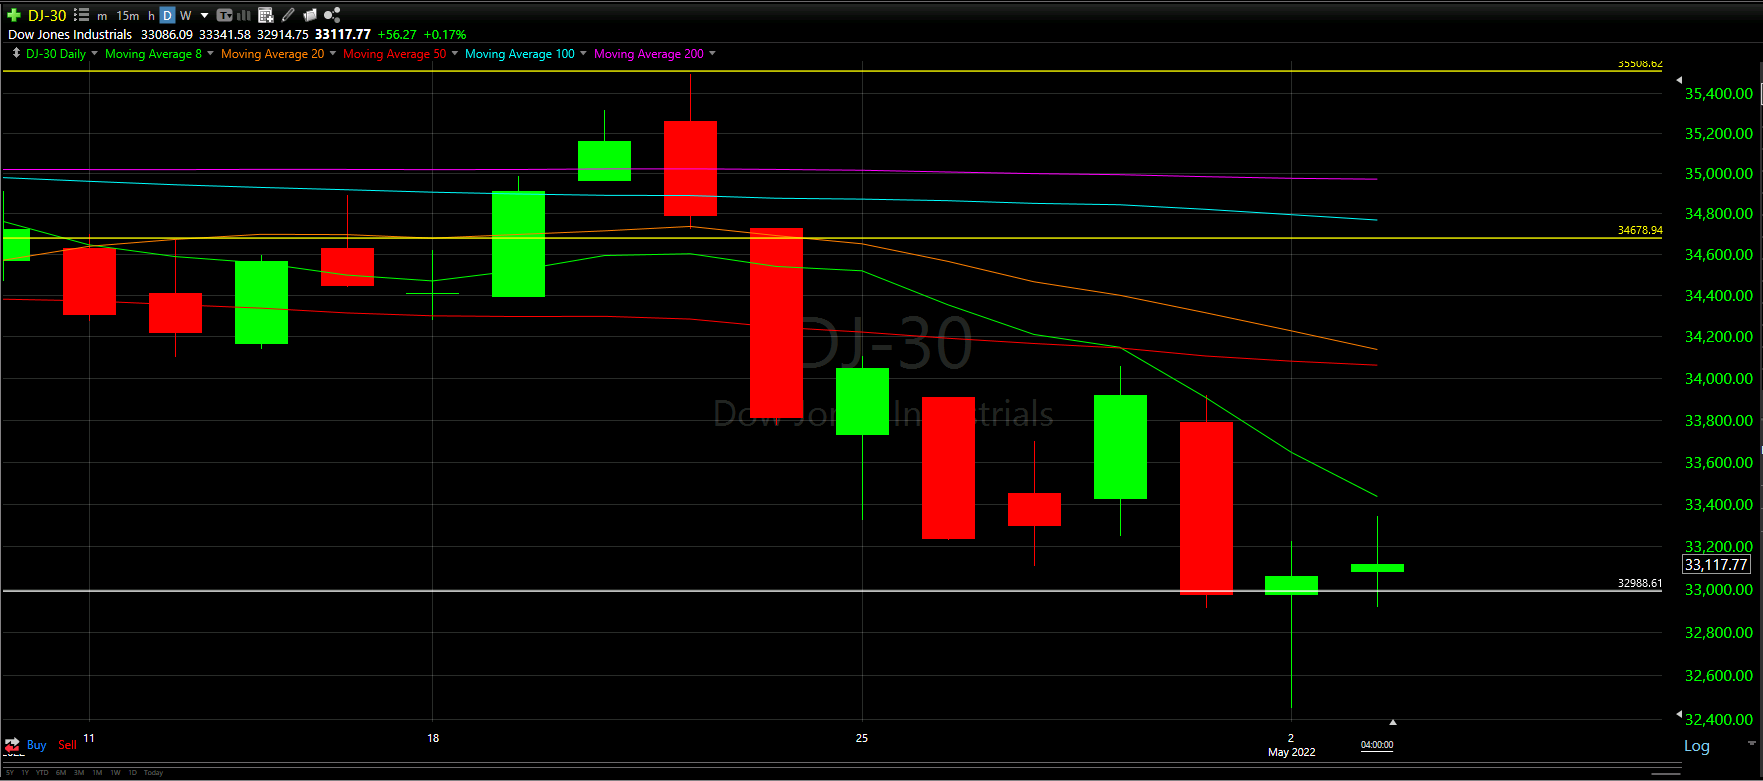
Though today was a very modest gain for the Dow Jones, Positive is always better than Negative!
On yesterday’s prediction, we wanted the day to close at or above 50% of the big red candle from a couple days ago. We can see the top of the wick got that high at some point in the day; however, we failed to close as high as we wanted.
It does seem like our Support line did actually support the fall and gave us a bounce upward. The big question is: Will this sustain??
Looking at the Moving Averages, we are still below the 8 Moving Average line (as well as all the others). Continue to stress the 8 Moving Average because closing over the 8MA will a big sign of recover, assuming it can sustain.
Based on our Top Half analysis, there is still no real sign that we hit the bottom and caution is still needed.
Bottom Half Analysis
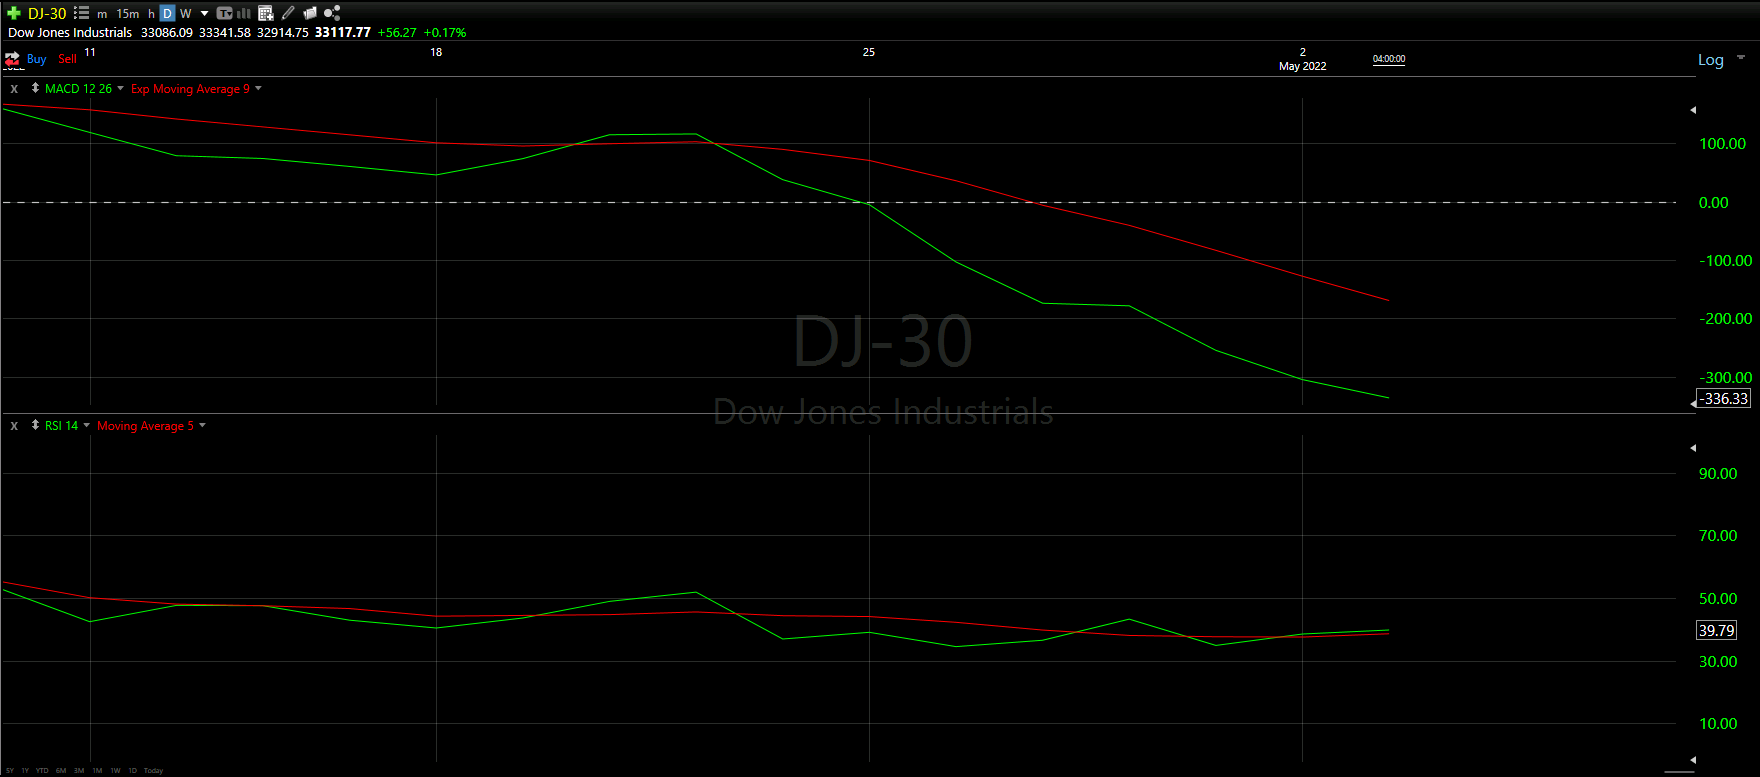
The goal of the Bottom Half analysis is to see a similar story between the MACD and RSI indicators. Ideally both are doing the thing, adding to the confidence of the readings.
For a second straight day, we see that there is a slight disconnect between the MACD and RSI indicators.
The MACD indicator continues to show the green line well under the red line. There seems to be a slight curve up forming, but by no means nothing worth overanalyzing. On the other hand, the RSI indicator continues to show the green peaking above the red line as well as a potential sign of an upswing in trend.
Overall, the reading the same as yesterday for the Bottom Half Analysis: Though we are not seeing the same story across the MACD and RSI indicators, The Chart Readers are leaning towards the MACD indicatory as being more accurate. There may be a chance of a small bounce up as the RSI seems to show; however, bigger picture seems to reflect the MACD readings.
Hourly Analysis

Though it took longer than expected, the big hourly close yesterday did in fact help propel today’s upward climb.
Though the first hour was technically negative, notated by the red candle, it never got below 50% of the big green candle of yesterday’s close. That is a positive sign to a negative hour.
From there, the next two hours were positive, with the 3rd hour really carrying today’s gains. However, the hour was stopped by the 20 Moving Average line in orange.
The last few hours really seemed to struggle beating the 20MA, ultimately taking away much of the gains we saw in the 3rd hour of trading as well as had us close just under the 8 Moving Average line in green.
Though we were able to get over the Support Line on this hourly view, the difficulty getting over the 20MA as well as closing under the 8MA provides us with less confidence than yesterday.
Final Thoughts and Targets
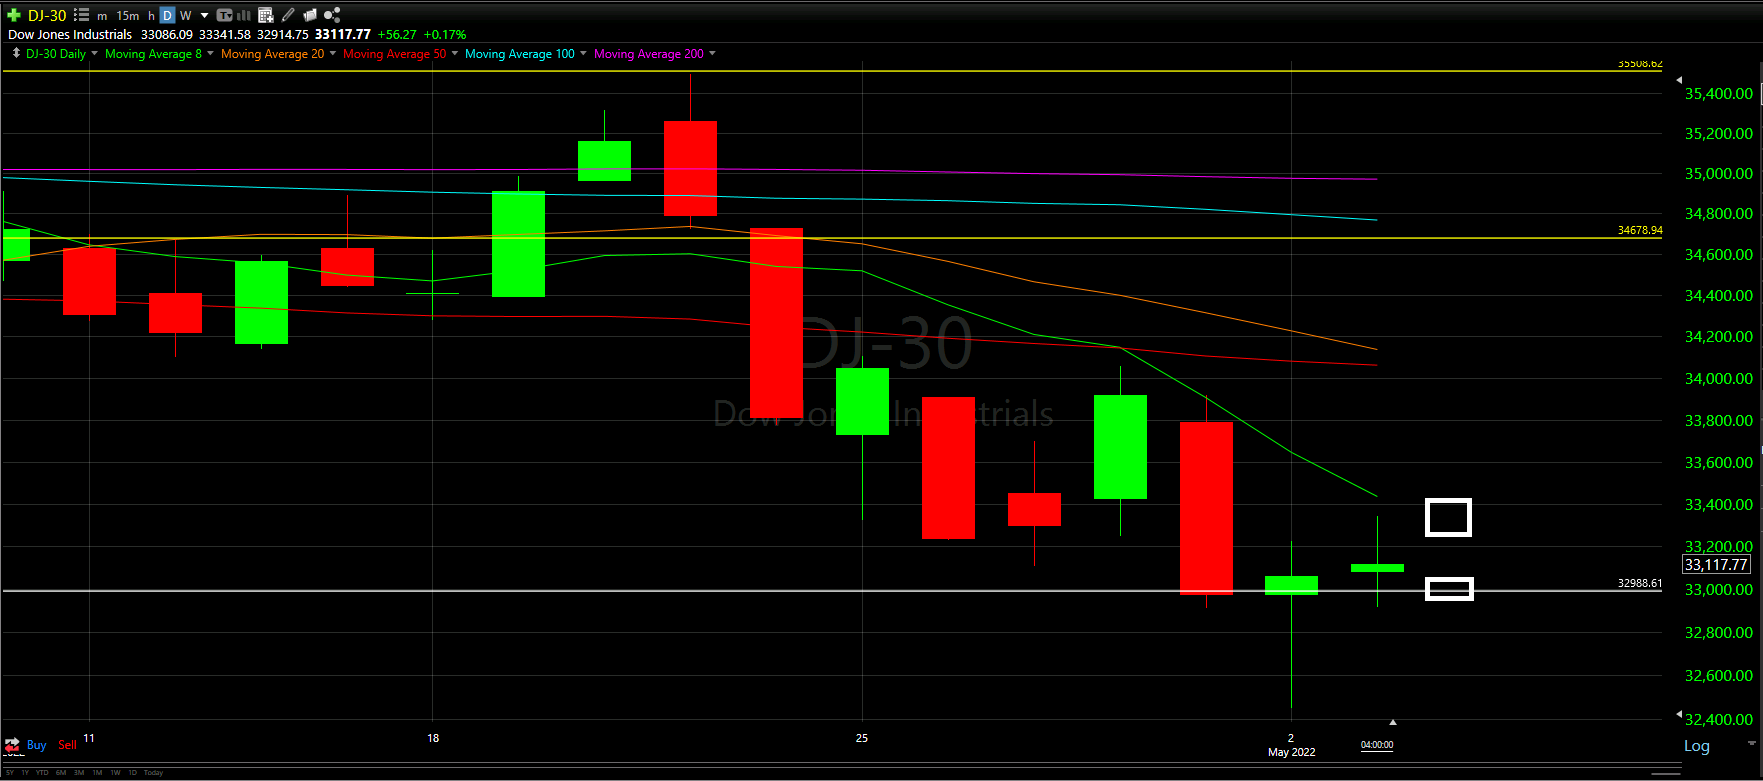
It seems the Dow Jones is heading for more of a drop, unless we can hold this bounce.
Recapturing about 50% of the large red candle 2 trading days ago as well as getting over the 8 Moving Average are still the two immediate needs!
The rough ending on the hourly chart as well as the inconsistent MACD and RSI indicators make it hard to believe things are getting better. However, sustaining this bounce and knocking out both our immediate needs can help paint a better picture
Here is hoping we curve upward!
Good luck trading!
Don’t forget to check out the Free Knowledge Center to refresh the basics or learn more about Technical or Fundamental Analysis