May 2nd Recap as well as May 3rd Predictions
Resetting Our Support and Resistance Lines
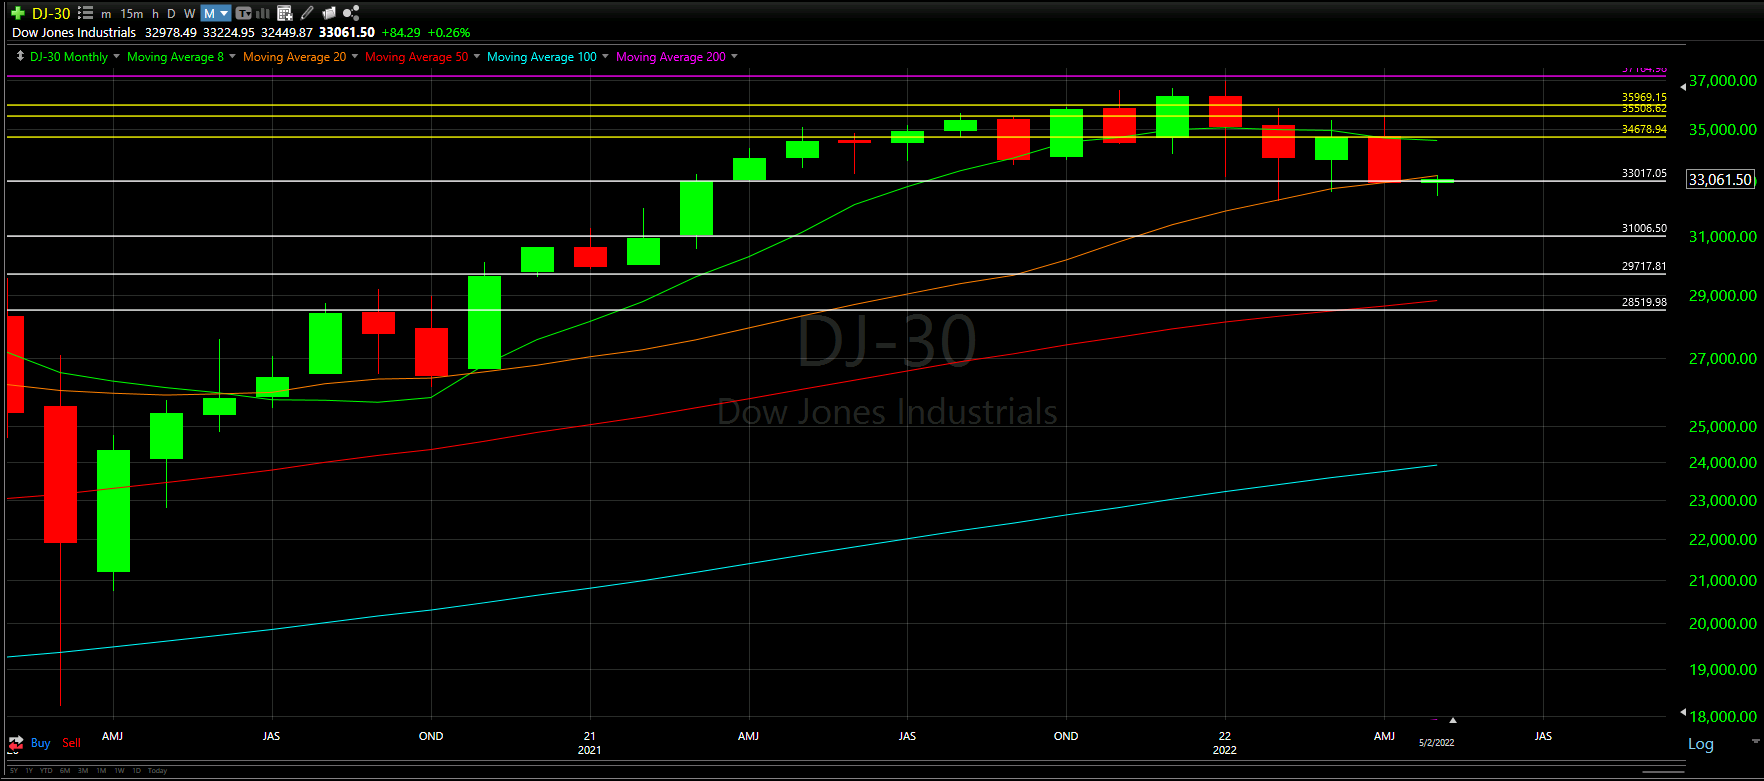
The last time Support and Resistance lines were drawn was back in January when this site started, with the three yellow lines were at the top being the main Support and Resistance lines from the January time.
From there we needed to take a MONTHLY view (notice the blue M on the top) to see what some key historic levels are to set our new. Support and Resistance lines.
Four new lines were created, based on April 2021, February 2021, November 2020, and August 2020 prices - all represented by the four new white lines.
Ironically enough, today we closed right on the newest Support and Resistance lines (that sincerely was not intended/known before writing this).
With the new Support and Resistance lines established, we are ready to do the usual Top and Bottom Analysis of the Dow Jones.
What to Expect in the Analysis Below
With the first trading day of May completed, let us see how the day played out and what to expect tomorrow.
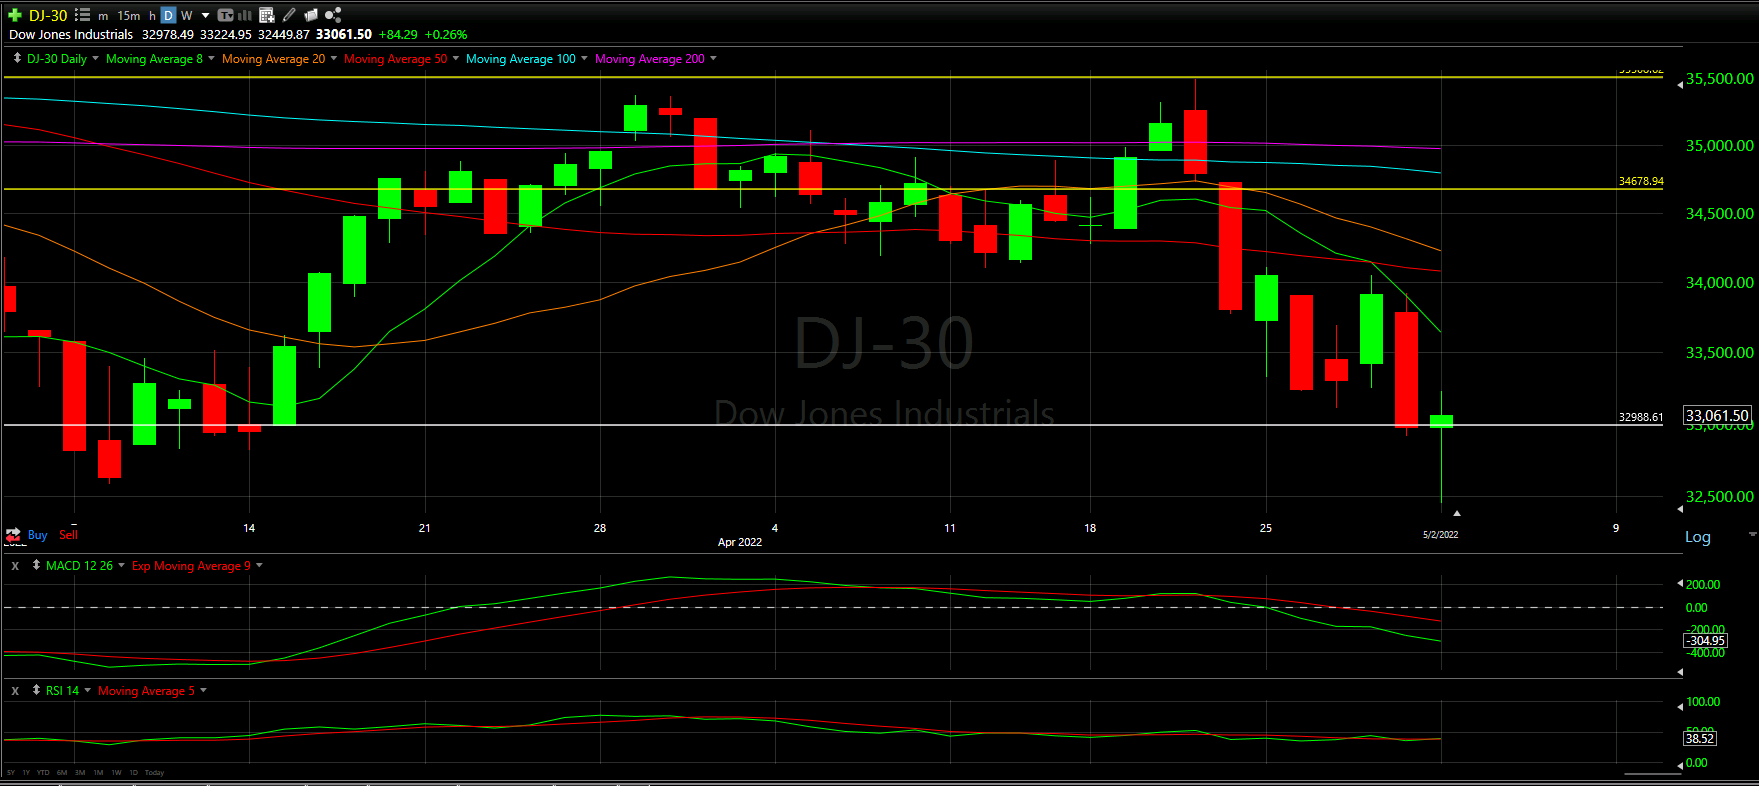
Above you will see the full view of the Daily chart, Top and Bottom Half indicators included.
As always, we will start by analyzing the Top Half of the Daily chart; seeing how our horizontal Support and Resistance Lines played out during the day, reviewing the Moving Averages that came into play as well as comparing previous candles.
From there, we will analyze the Bottom Half of the Daily chart to see what the momentum looks like going into tomorrow with the additional MACD and RSI indicators.
Ultimately, we will use the combined data to help predict the movement of the Dow Jones for tomorrow.
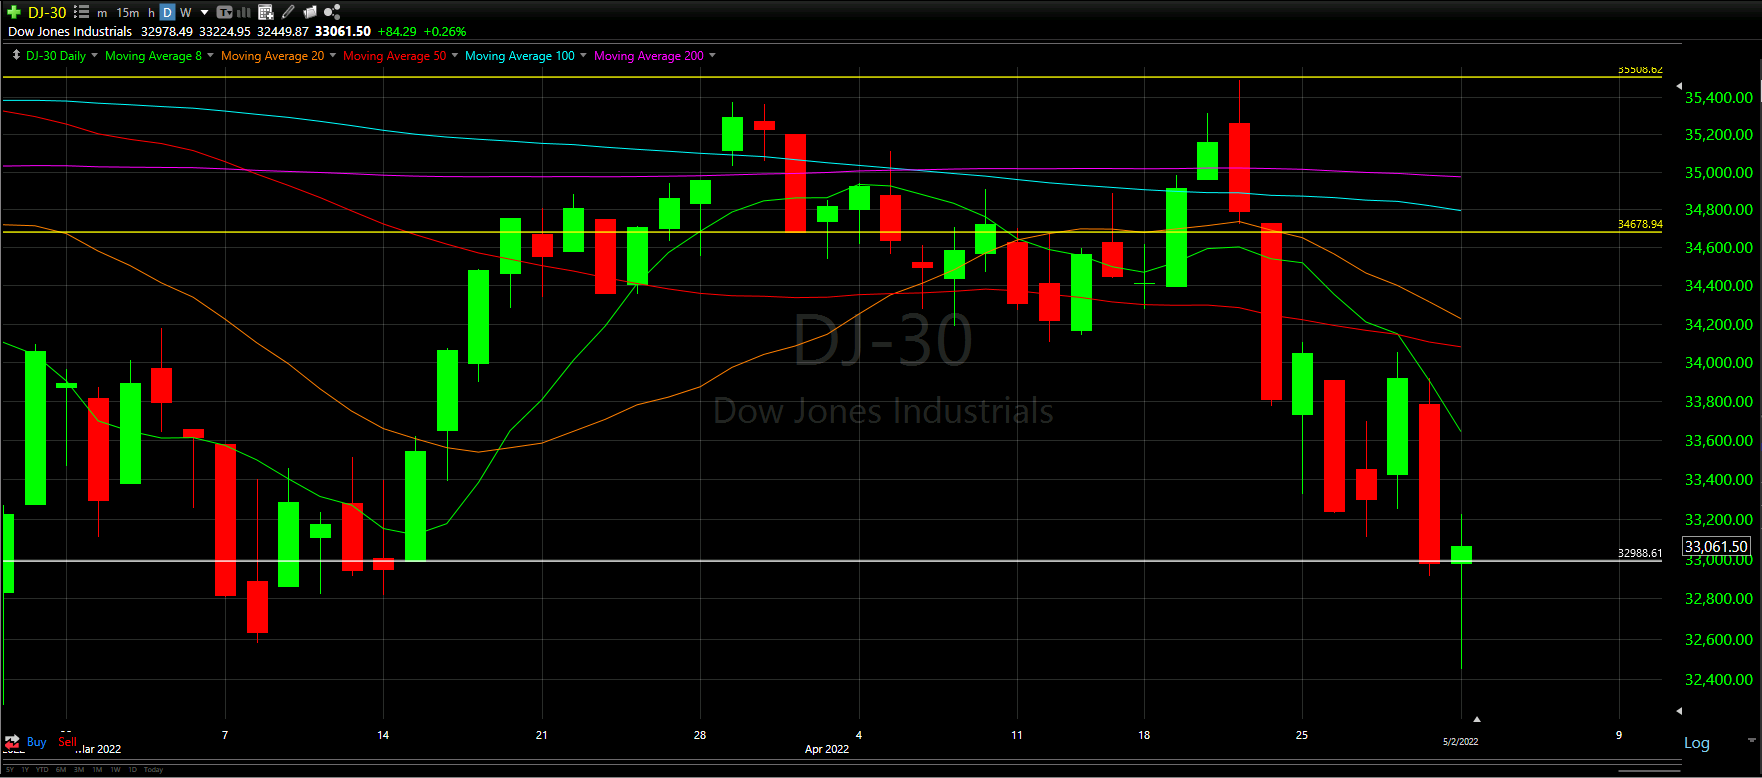
Top Half Analysis
It goes without saying that the overall markets have been doing poorly; however, let us try to look at why.
The day we lost the yellow Support line around $34,600 really drove the the sharp decline. The red candle on April 24 was clearly the day the Support line was lost and it became a race to the bottom.
Today was a key trading day for the Dow Jones because we closed right on our newest Support line - created in the section above. We must hold this, and ideally bounce up a little. Otherwise, there is a high likelihood that we drop all the way down to around $31,000 - the next white Support line below (not in the image because it is so far down).
Looking at the Moving Averages, it is clear that we have nothing positive going on. The Dow Jones has been trading under the 8 Moving Average line for the last seven trading days on top of the fact that we are trading under every other Moving Average line - 20, 50, 100, & 200 Moving Averages.
Based on our Top Half analysis, there is clear reason to believe the pain is not over yet for the Dow Jones
Bottom Half Analysis
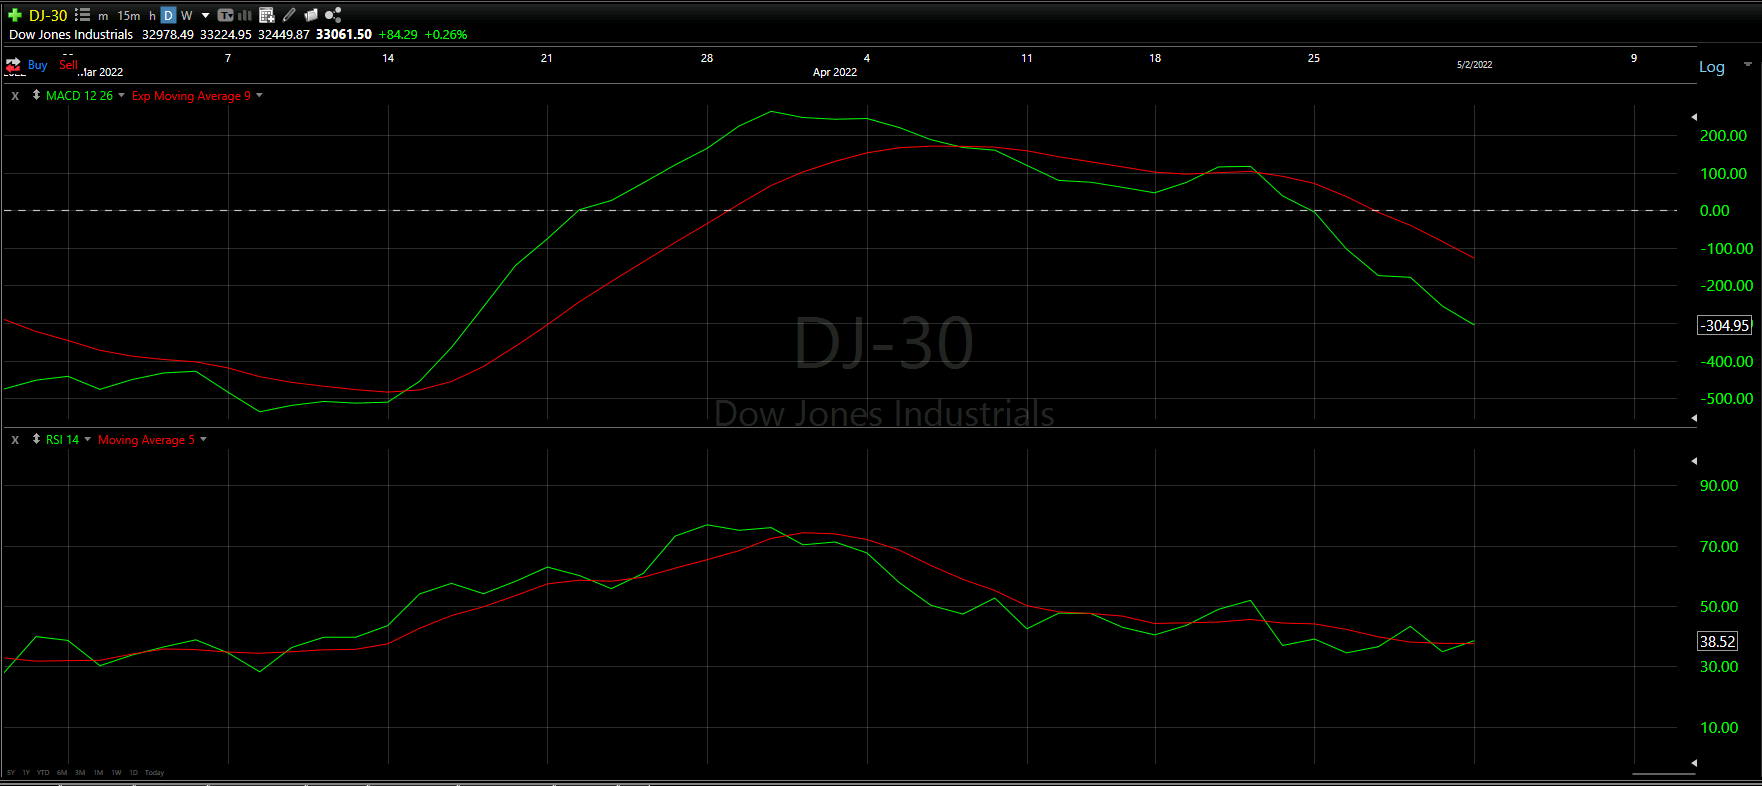
The goal of the Bottom Half analysis is to see a similar story between the MACD and RSI indicators. Ideally both are doing the thing, adding to the confidence of the readings.
Here, we see that there is a slight disconnect between the MACD and RSI indicators.
The first thing to notice is that the MACD indicator has the green line well under the red line, with no real sign of turning that trend around. Overall, this is a very bad sign. Green should always be above Red. On the other hand, the RSI indicator actually has the green peaking above the red line as well as a potential sign of an upswing in trend.
Though we are not seeing the same story across the MACD and RSI indicators, The Chart Readers are leaning towards the MACD indicatory as being more accurate. There may be a chance of a small bounce up as the RSI seems to show; however, bigger picture seems to reflect the MACD readings.
Hourly Analysis

The hourly chart for the Dow Jones might be the first sign of positivity!
Clearly the majority of the day was a downhill tanking. The first two hours had moments of positivity as well as total tanking; however, it was not until the third hour that the day seemed the darkest.
From the third to the sixth hour, it seemed the day was doomed for another bloodbath; however, the day was essentially saved at the last hour of the day.
The MACD and RSI indicators for this hourly chart seem to show a chance for a good start to tomorrow, 5/3/22.
Final Thoughts and Targets

Our best hope would be that the new Support line and positive RSI Indicator reading catches this fall; otherwise, we could be heading down even lower.
We really need to get over that 8 Moving Average line!
Good luck trading!
Don’t forget to check out the Free Knowledge Center to refresh the basics or learn more about Technical or Fundamental Analysis