January 4th recap and 5th Predictions
What to Expect
With the second trading day of January completed, let us see how the day played out and what to expect tomorrow.
As we will always do, the first thing to be reviewed will be Top Half of the Daily chart. We will see how the horizontal Support and Resistance Lines from our January Monthly Prediction played out during the first day, as well as review the Moving Averages that came into play.
From there, we will look at the Bottom Half of the Daily chart to see what the momentum looks like going into tomorrow with the additional MACD and RSI indicators.
Overall, the results were worse than we predicted seemed to have played out as we will see below:
Top Half Analysis
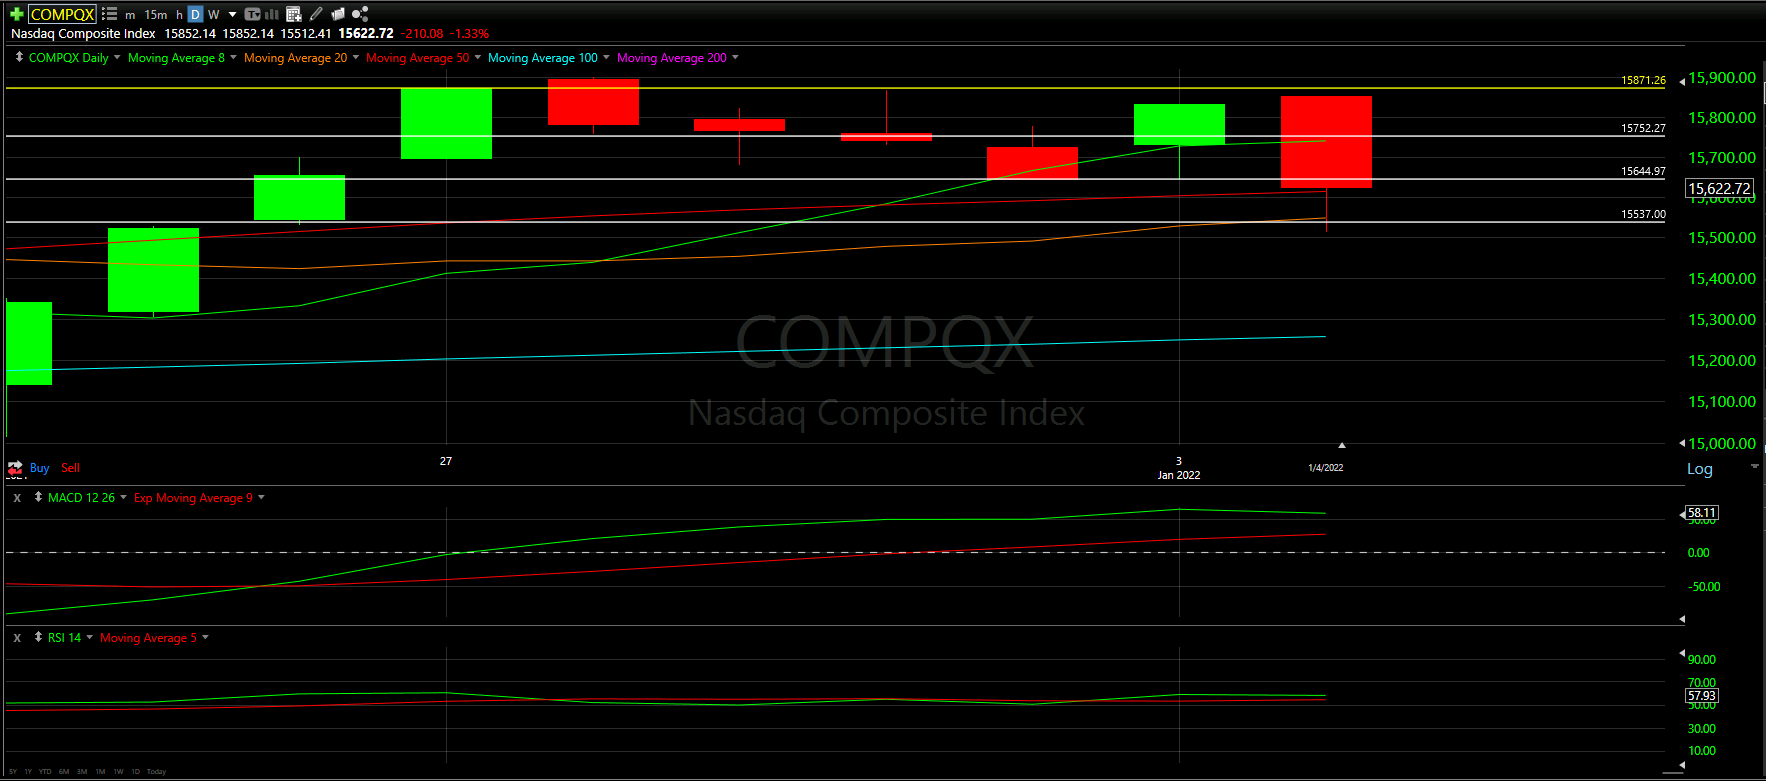
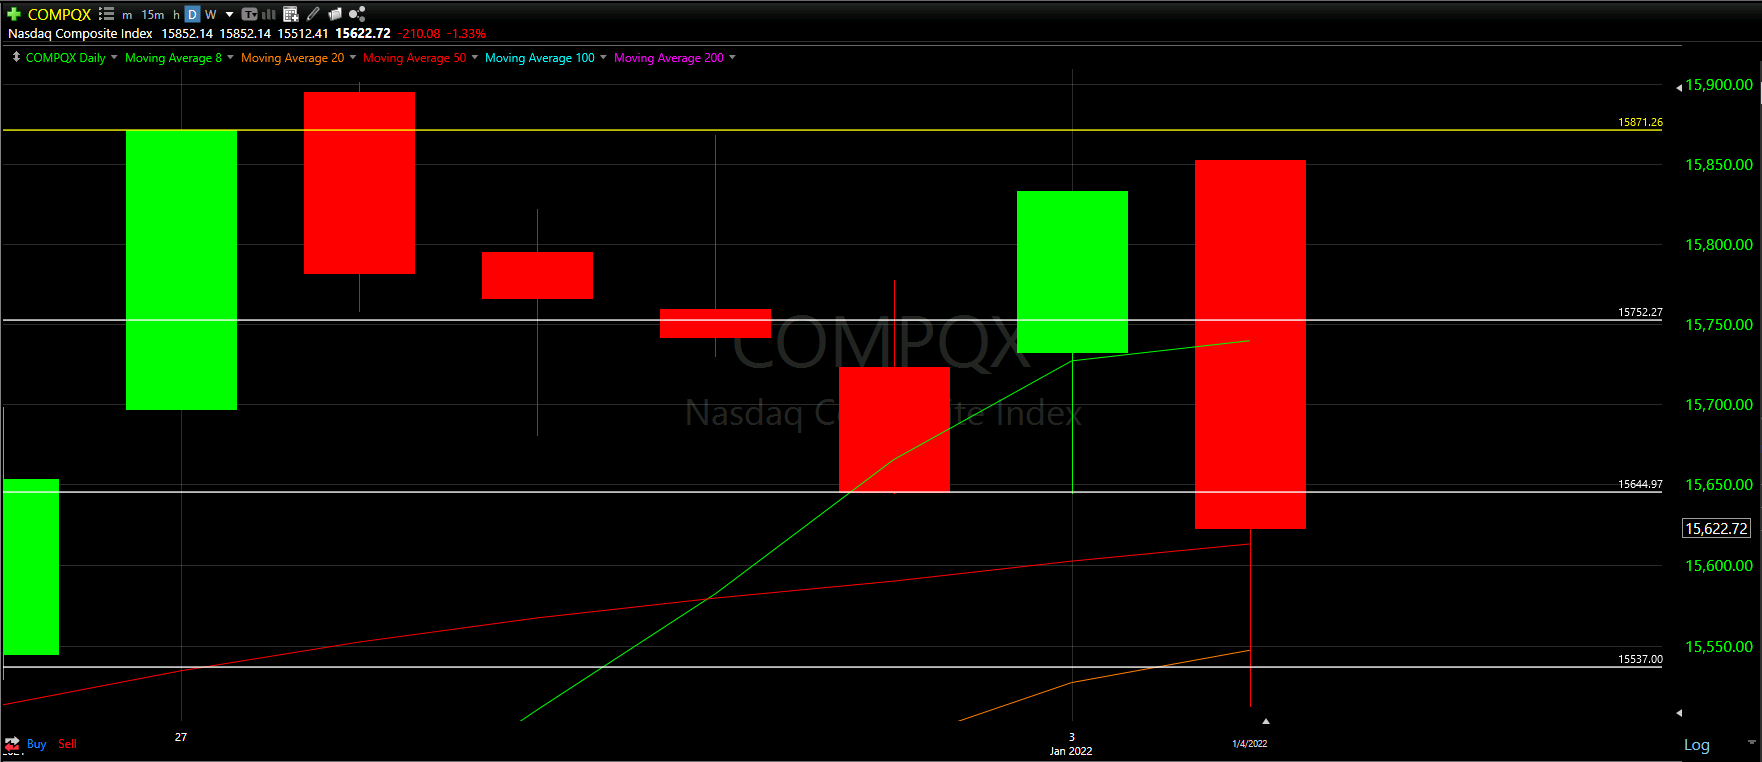
What an UGLY day to say the least! Nothing worse than a giant red candle closing under the 8 Moving Average (well, actually it can get much much worse).
Today was a rough day for the NASDAQ with the large red candle ripping down from what looked like a nice gap up from yesterday.
We start slightly above the high of yesterday, almost at the 50% line of the large red candle on 12/28/21. However, the day turns red and actually tanks even lower than the close at some points of the day, based on the very long wick at the bottom of today’s candle.
In one day we lost: 50% of yesterday’s candle, the first support line, and the second support line. Ouch.
Unfortunately, we are now trading well below the 8 Moving Average and are about to test the 50 Moving Average, with the 20 Moving Average not too far below. The last thing we want to do is lose more Moving Averages and trade below these.
Overall, the Top Half technical analysis of the NASDAQ has been worrisome. Let us see if this carries over to the Bottom Half technical analysis as we look at the momentum indicators.

Bottom Half Analysis
Starting with the MACD, it is concerning to see the sharp decline in the Green line combined with the continued rise of the Red lin. This looks to be the closest the lines have been in a bit.
The RSI looks to be doing the same thing as the MACD. There is a clear downward bend in the Green line and Red line seems to be closing in on the Green line.
Unfortunately, the momentum seems to be shifting in the wrong direction for the NASDAQ

Hourly Analysis
As mentioned above, the first hour wanted to seem promising by actually starting higher than yesterday’s positive day.
That said, we quickly saw 5 straight hour of losses for the NASDAQ - a rough day to overcome.
The second hour of the day seemed to be the real dagger in the heart - losing the 8, 20, and 50 Moving Averages as well as 2 of the 3 Support Lines we established.
The 5th hour seems to be saved by the 200 Moving Average, with a slight bounce up during the final trading hours of the day.
None the less, we did not get over the 8 Moving Average during the last hour. This may be indicative of a lower start to tomorrow’s day

Final Thoughts and Targets
Overall, there was a lot of to be worried about in the daily and hourly charts for the NASDAQ.
This may be the first Bearish Warring for the NASDAQ; however, let us wait to see what tomorrow confirms. There is a chance we can bounce up from the 50 Moving Average and come back to where we left off. Otherwise, we might keep slipping and lose a number of key supports.
Trade with caution to say the least, especially with tech heavy tickets; however, let us wait for one more day of confirmation before waving the panic flag.
Good luck trading!