January 5th recap and 6th Predictions
What to Expect
With the third trading day of January completed, let us see how the day played out and what to expect tomorrow.
As we will always do, the first thing to be reviewed will be Top Half of the Daily chart. We will see how the horizontal Support and Resistance Lines from our January Monthly Prediction played out during the first day, as well as review the Moving Averages that came into play.
From there, we will look at the Bottom Half of the Daily chart to see what the momentum looks like going into tomorrow with the additional MACD and RSI indicators.
Overall, the results we predicted seemed to have played out, just much more extreme
Top Half Analysis
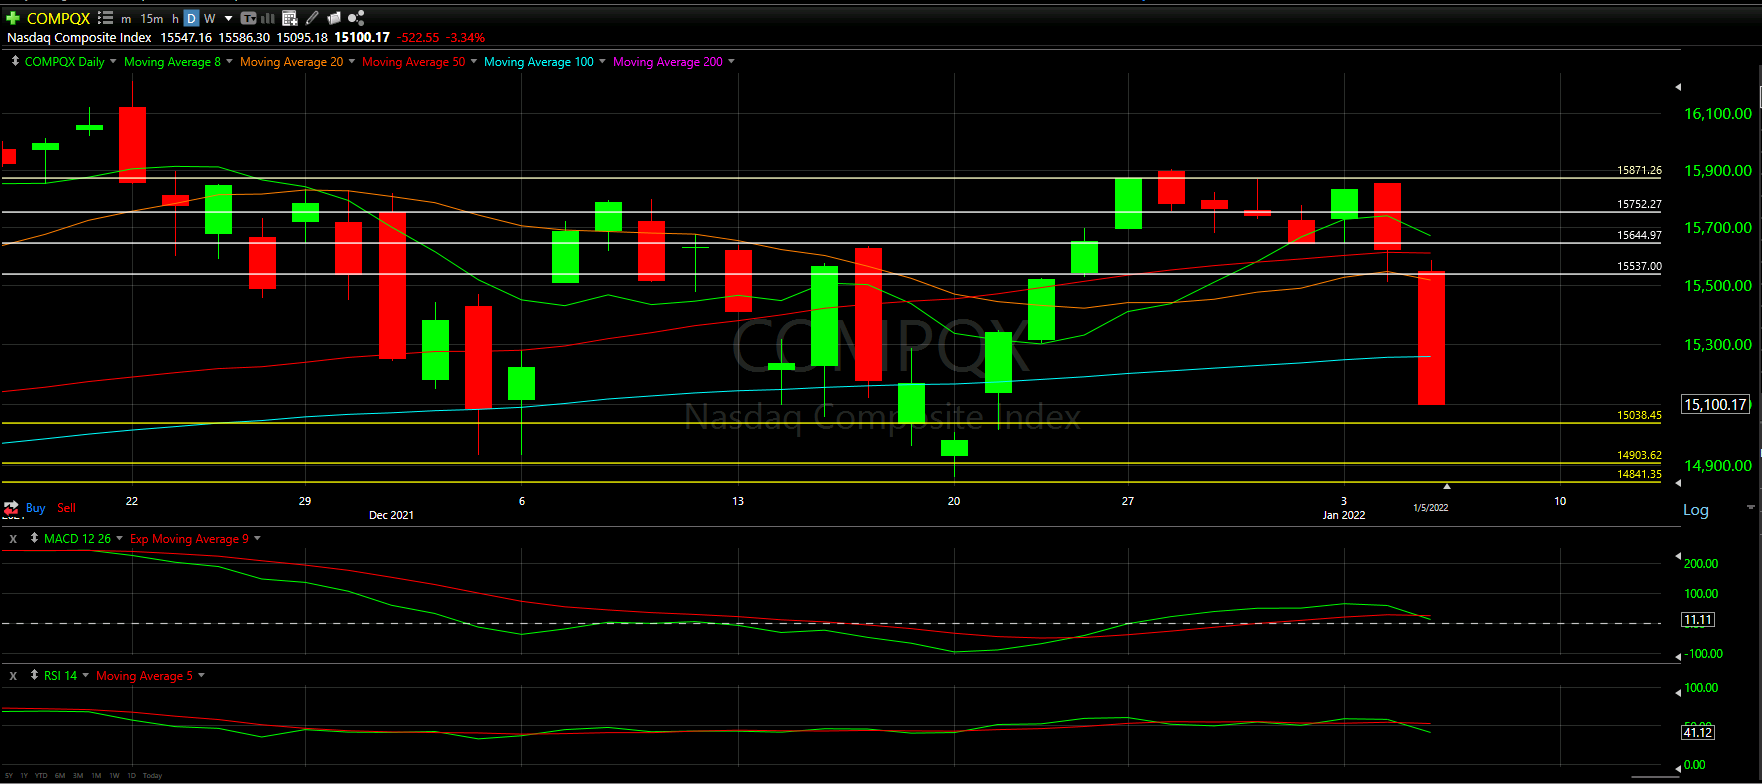
If yesterday was an UGLY today, that would mean today was HORRIBLE. The red candle is nearly 2x yesterday’s size!
The NASDAQ opened right at one of our original Support Lines from the Monthly Prediction, and quickly headed down from there. Gapping down is never a good start to a trading day, and clearly the NASDAQ was never recovered.
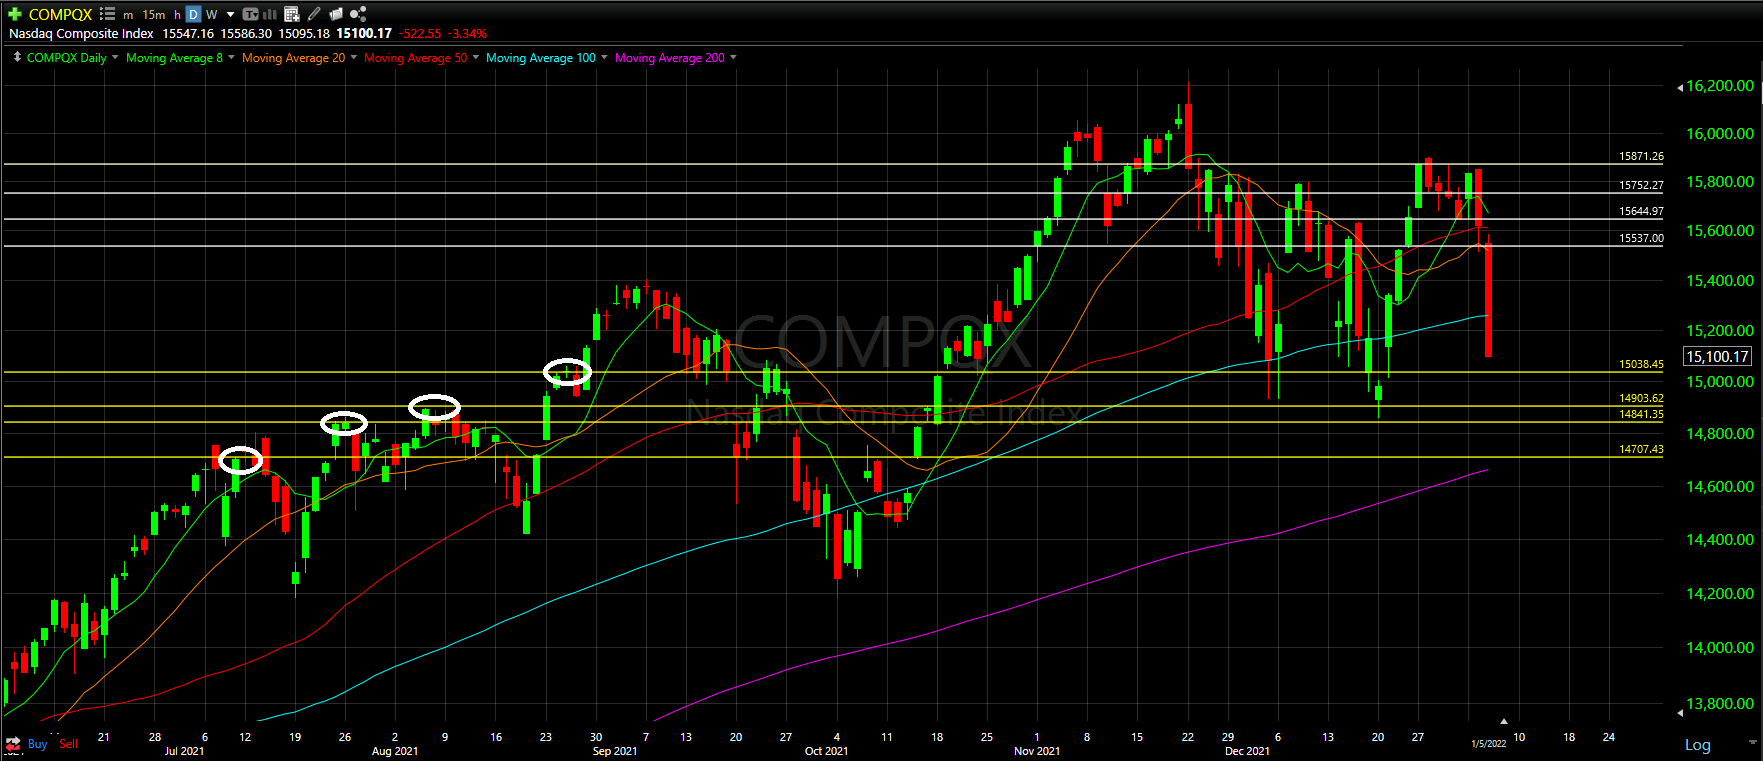
As a result of today’s drop, we needed to create more Support Lines much lower than had. To do this we go back to Summer of 2021 to find 4 points that seem to create a strong support base - all 4 circled above. Ideally we can use these to predict where the NASDAQ may drop to before bouncing back up.
Yesterday’s closing under the 8 Moving Average was magnified today as the NASDAQ lost more moving averages. The day lost the 20, 50, and the 100 Moving Averages. HORRIBLE indeed! The only Moving Average left is the 200 - if the NASDAQ is unable to bounce up by the 200 Moving Average, it can get really really bad.
We will be watching!
Overall, the Top Half technical analysis of the NASDAQ has been worrisome. Let us see if this carries over to the Bottom Half technical analysis as we look at the momentum indicators.
Bottom Half Analysis
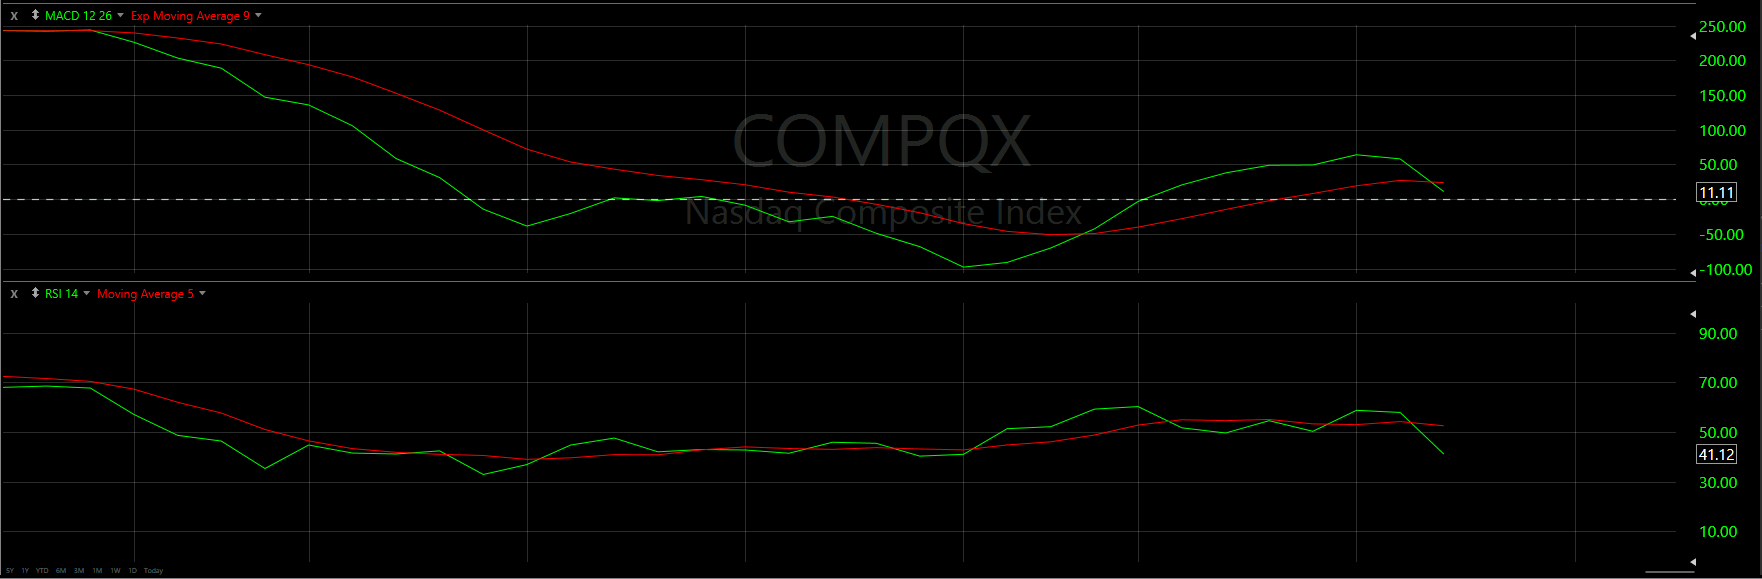
Starting with the MACD, yesterday’s sharp decline in the Green line combined with the continued rise of the Red line continued today. We now have a cross under the Red line, and it seems the green line is not out of the nosedive. Momentum is not looking good based on this indicator
It does not take an expert to see the RSI is actually doing worse than the MACD. Once again we see a sharp cross under the Red line and it seems the RSI is a lot further under already. with the nosedive seemingly still going, there is nothing but negative momentum on this indicator as well
Unfortunately, the momentum continues to be shifting in the wrong direction for the NASDAQ

Hourly Analysis
Unlike the Dow Jones Hourly chart, there was very little chance anyone got fooled today.
The day started with a green candle; however, it did gap down from yesterday’s close and started under the 8 Moving Average.
From there 5 of the 6 remaining hours in the day were negative, and the only positive hour never came close to recapturing 50% of the previous candle.
There is not too much to analyze in a downtrend hourly chart like this.

Final Thoughts and Targets
Overall, today’s performance from the NASDAQ confirmed our Bearish Warring from yesterday.
With the horrible MACD and RSI, there is little faith in having a positive day. Maybe there is a slight oversold bounce tomorrow and we end up near the White Rectangle. Otherwise, as we feel from the above notes, the NASDAQ continues the drop down before either a support line or the 200 Moving Average help create a sustainable bounce up.
Good luck trading!