May 3rd Recap as well as May 4th Predictions
What to Expect in the Analysis Below

With the second trading day of May completed, let us see how the day played out and what to expect tomorrow.
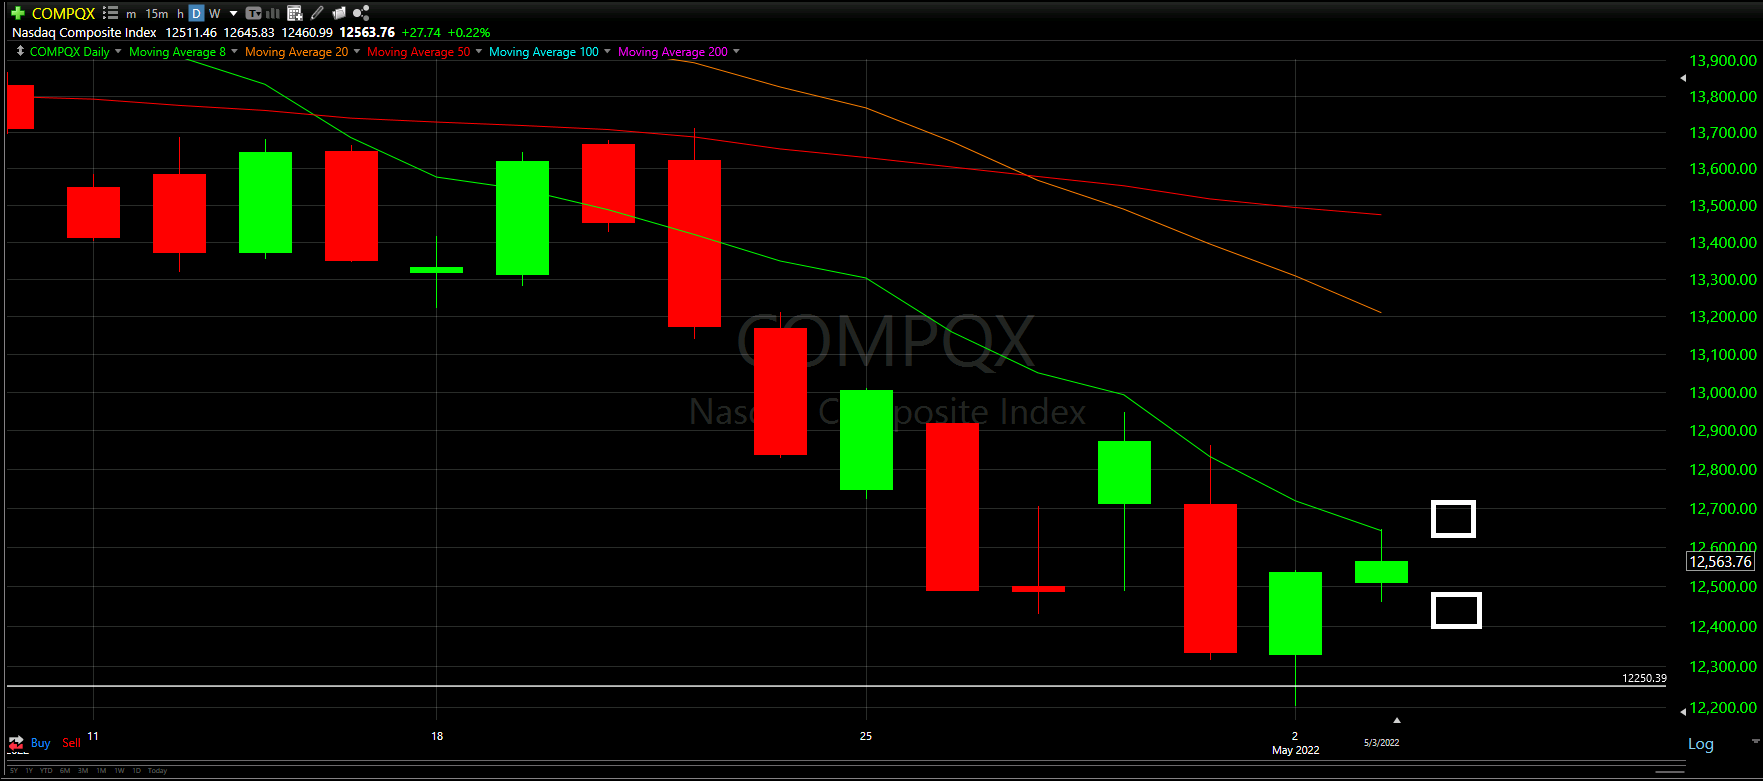
Above you will see the full view of the Daily chart; Top and Bottom indicators included.
As always, we will start by analyzing the Top Half of the Daily chart; seeing how our horizontal Support and Resistance Lines played out during the day, reviewing the Moving Averages that came into play as well as comparing previous candles.
From there, we will analyze the Bottom Half of the Daily chart to see what the momentum looks like going into tomorrow with the additional MACD and RSI indicators.
Ultimately, we will use the combined data to help anticipate the movement of the NASDAQ for tomorrow.
Top Half Analysis

Though the total percentage gain was pretty modest for the NASDAQ Composite, they day closed where we wanted overall.
On yesterday’s prediction, we wanted the day to close at or above 50% of the big red candle from a couple days ago. That pretty much happened exactly! That is a pretty positive sign; however, we still need a few more before we can feel any confidence in these bad conditions
Looking at the Moving Averages, we are still below the 8 Moving Average line (as well as all the others). But look - the top of the wick actually went above the 8MA momentarily. Closing is FAR more important than the top of a wick; however, it is a good sign, and actually overall better than the Dow Jones showed today.
Based on our Top Half analysis, there is still no real sign that we hit the bottom and caution is still needed. There were more positive moments here than expected, but we try to stay optimistic when possible. Caution is still needed!
Bottom Half Analysis
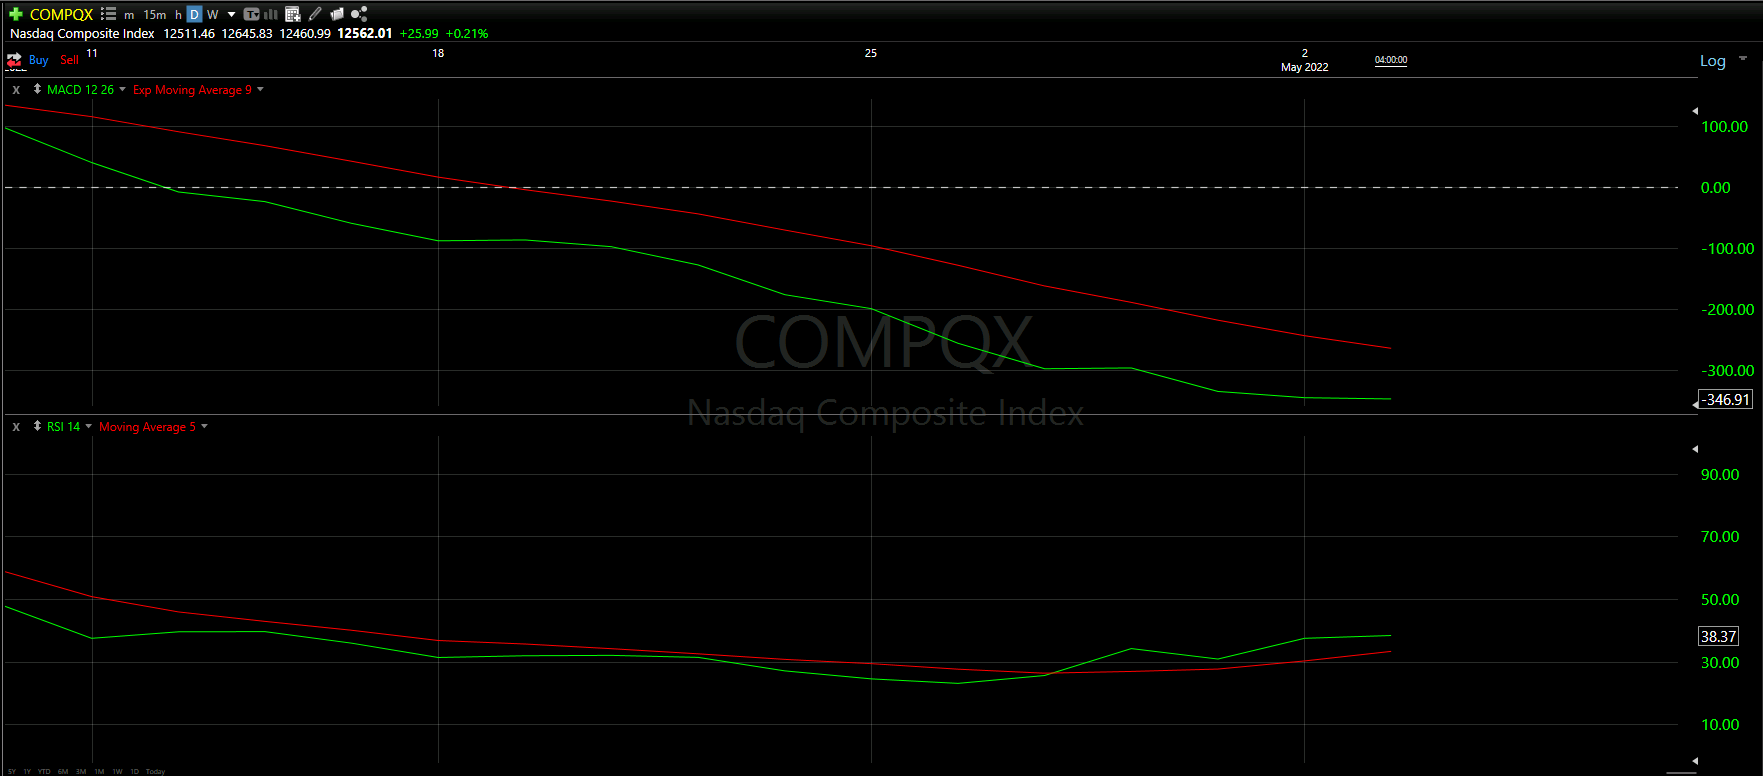
The goal of the Bottom Half analysis is to see a similar story between the MACD and RSI indicators. Ideally both are doing the thing, adding to the confidence of the readings.
For a second straight day, we see that there is a slight disconnect between the MACD and RSI indicators.
The MACD indicator continues to show the green line well under the red line. There seems to be a slight curve up forming, but by no means nothing worth overanalyzing. On the other hand, the RSI indicator continues to show the green peaking above the red line, but it looks like there is downward curve showing.
Overall, the reading the same as yesterday for the Bottom Half Analysis: Though we are not seeing the same story across the MACD and RSI indicators, The Chart Readers are leaning towards the MACD indicatory as being more accurate. There may be a chance of a small bounce up as the RSI seems to show; however, bigger picture seems to reflect the MACD readings.
Hourly Analysis
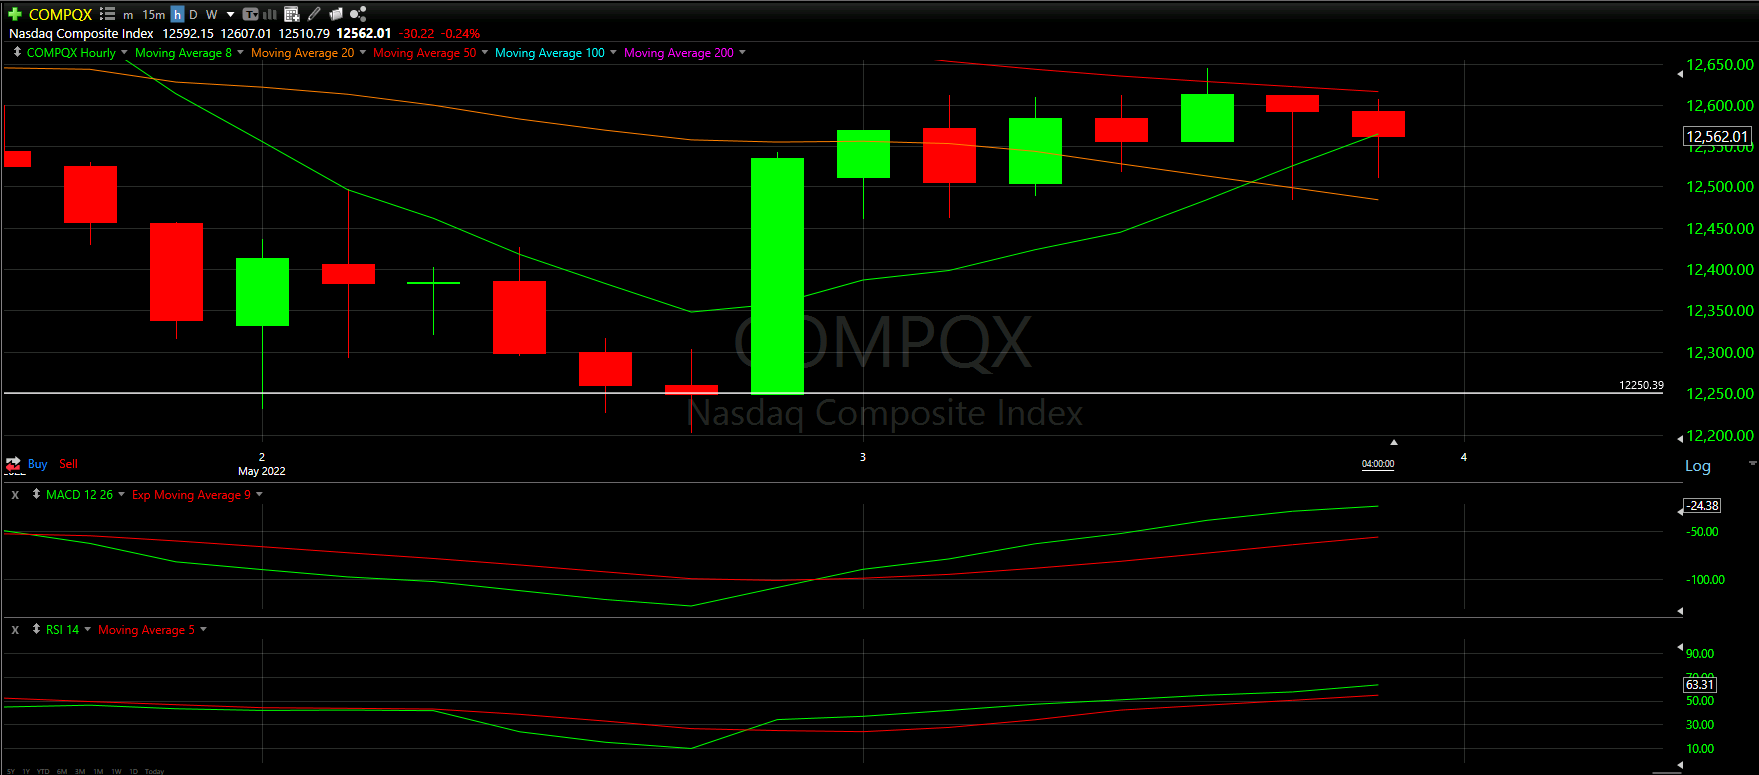
As we hoped, the big close yesterday did in fact help propel today’s upward climb, with a good start to the day on the first hour.
The second hour seemed to be a troubling sign, as it actually took all the gains of the 2nd hour and closed in the red.
Unlike the Dow Jones, the NASDAQ was able to surpass the 20 Moving Average line in orange; however, the 50 Moving Average line in red seemed to be the Resistance wall here.
As mentioned, the last few hours really seemed to struggle beating the 50MA, ultimately giving up much of the gains we saw as well as had us close just under the 8 Moving Average line in green.
Though we were able to get over the Support Line on this hourly view, the difficulty getting over the 50MA as well as closing under the 8MA provides us with less confidence than yesterday.
Final Thoughts and Targets
The NASDAQ seems to be the most optimistic of the 3 Major Markets.
Recapturing about 50% of the large red candle was a major accomplishment!
Now we need to close above the 8 Moving Average to really emphasize this accomplishment as more than just a random occurrence.
The rough ending on the hourly chart as well as the inconsistent MACD and RSI indicators make it hard to believe things are getting better. However, sustaining this bounce and knocking out our final immediate need can help paint a better picture
Here is hoping we curve upward!
Good luck trading!
Don’t forget to check out the Free Knowledge Center to refresh the basics or learn more about Technical or Fundamental Analysis