May 4th Recap as well as May 5th Predictions
What to Expect in the Analysis Below
With the third trading day of May completed, let us see how the day played out and what to expect tomorrow.
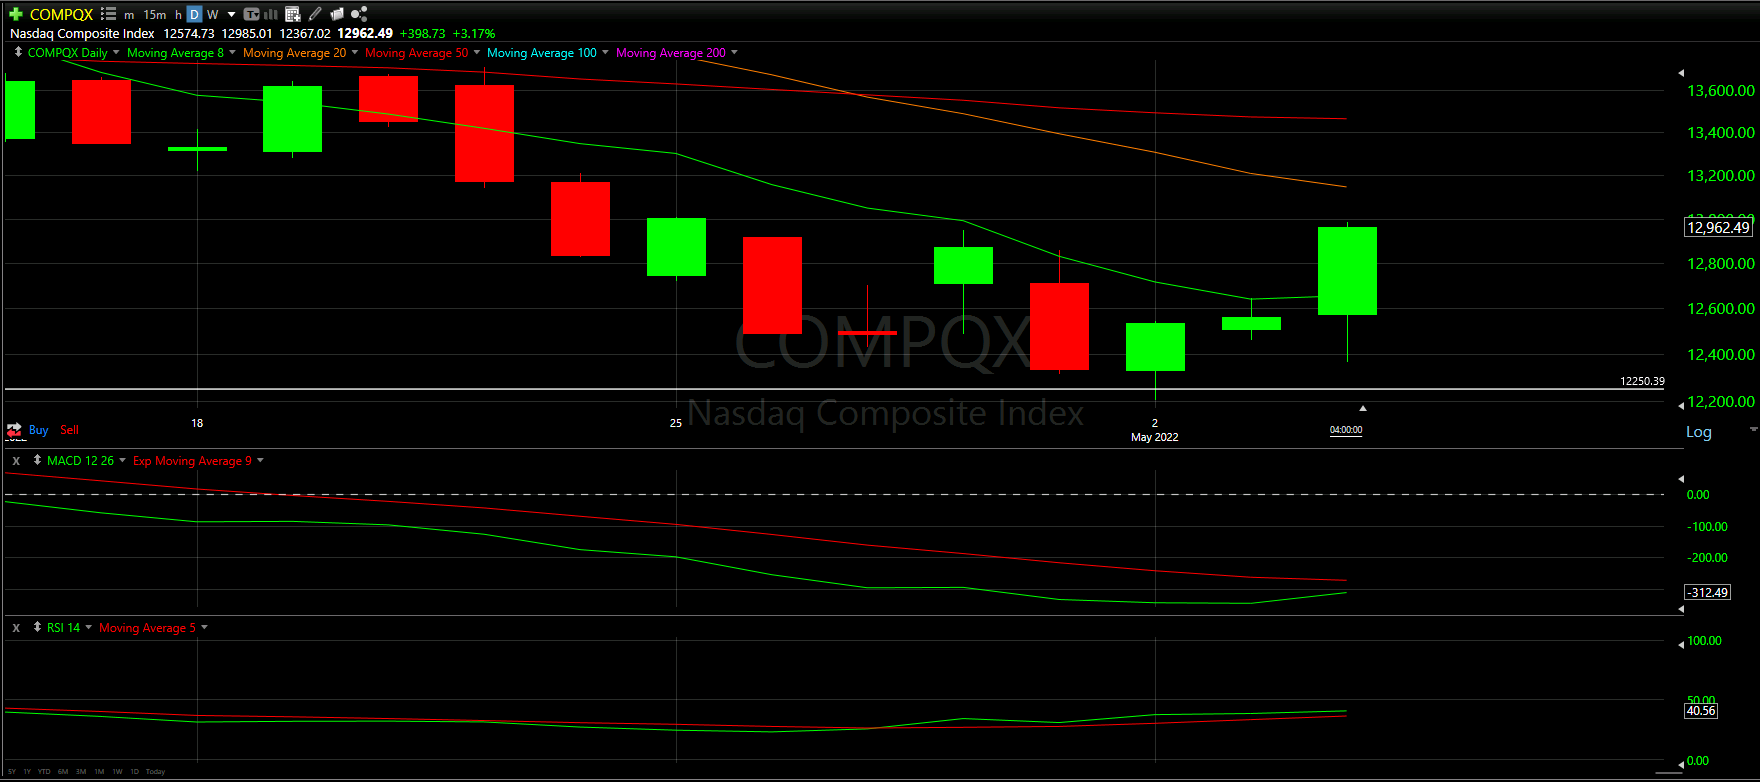
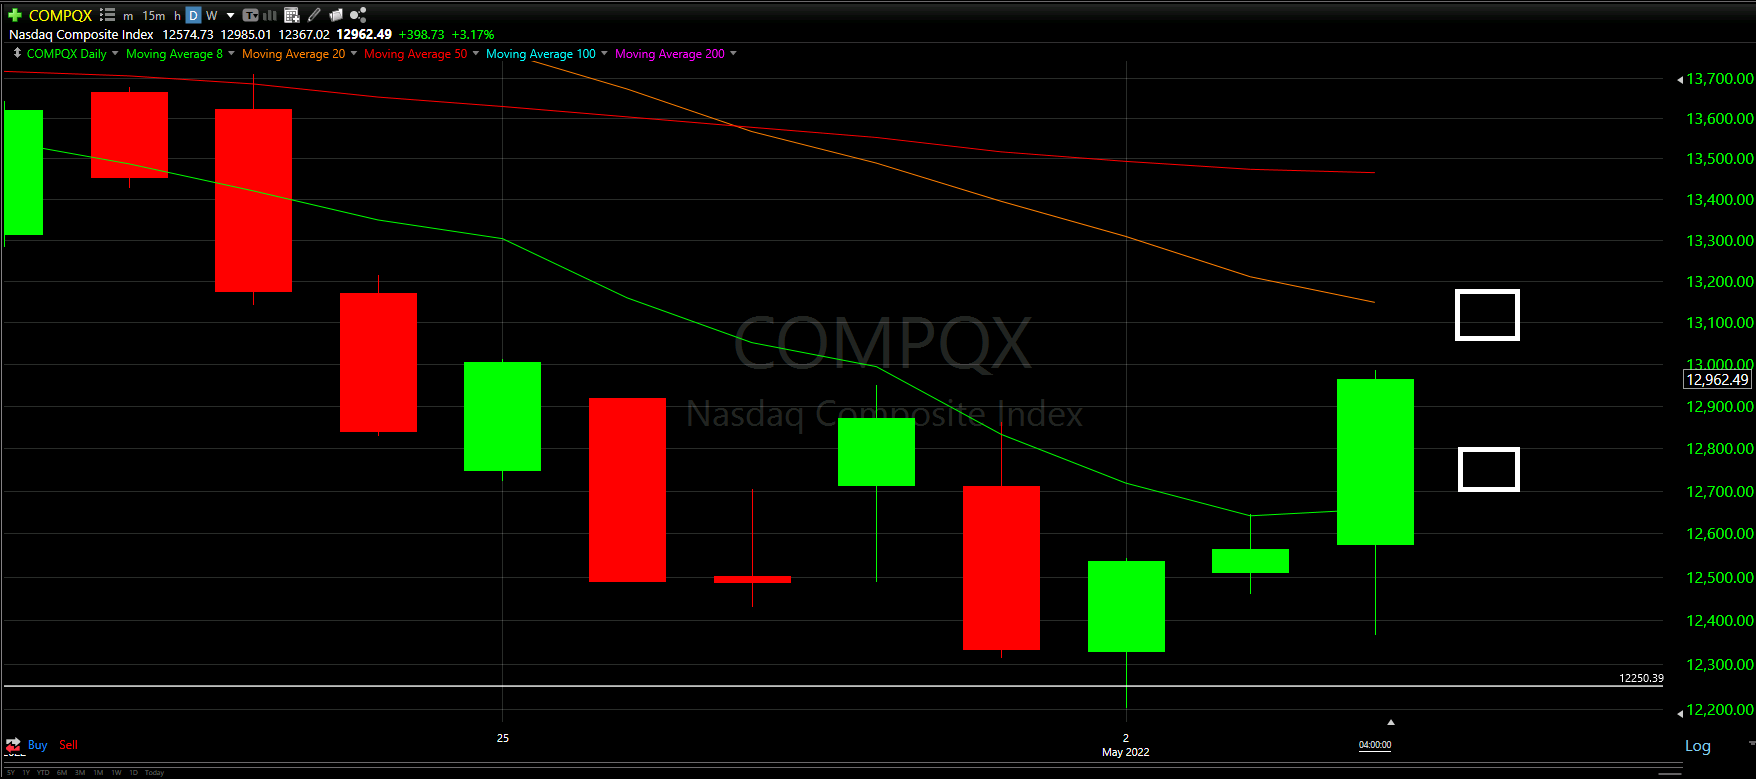
Above you will see the full view of the Daily chart; Top and Bottom indicators included.
As always, we will start by analyzing the Top Half of the Daily chart; seeing how our horizontal Support and Resistance Lines played out during the day, reviewing the Moving Averages that came into play as well as comparing previous candles.
From there, we will analyze the Bottom Half of the Daily chart to see what the momentum looks like going into tomorrow with the additional MACD and RSI indicators.
Ultimately, we will use the combined data to help anticipate the movement of the NASDAQ for tomorrow.
Top Half Analysis
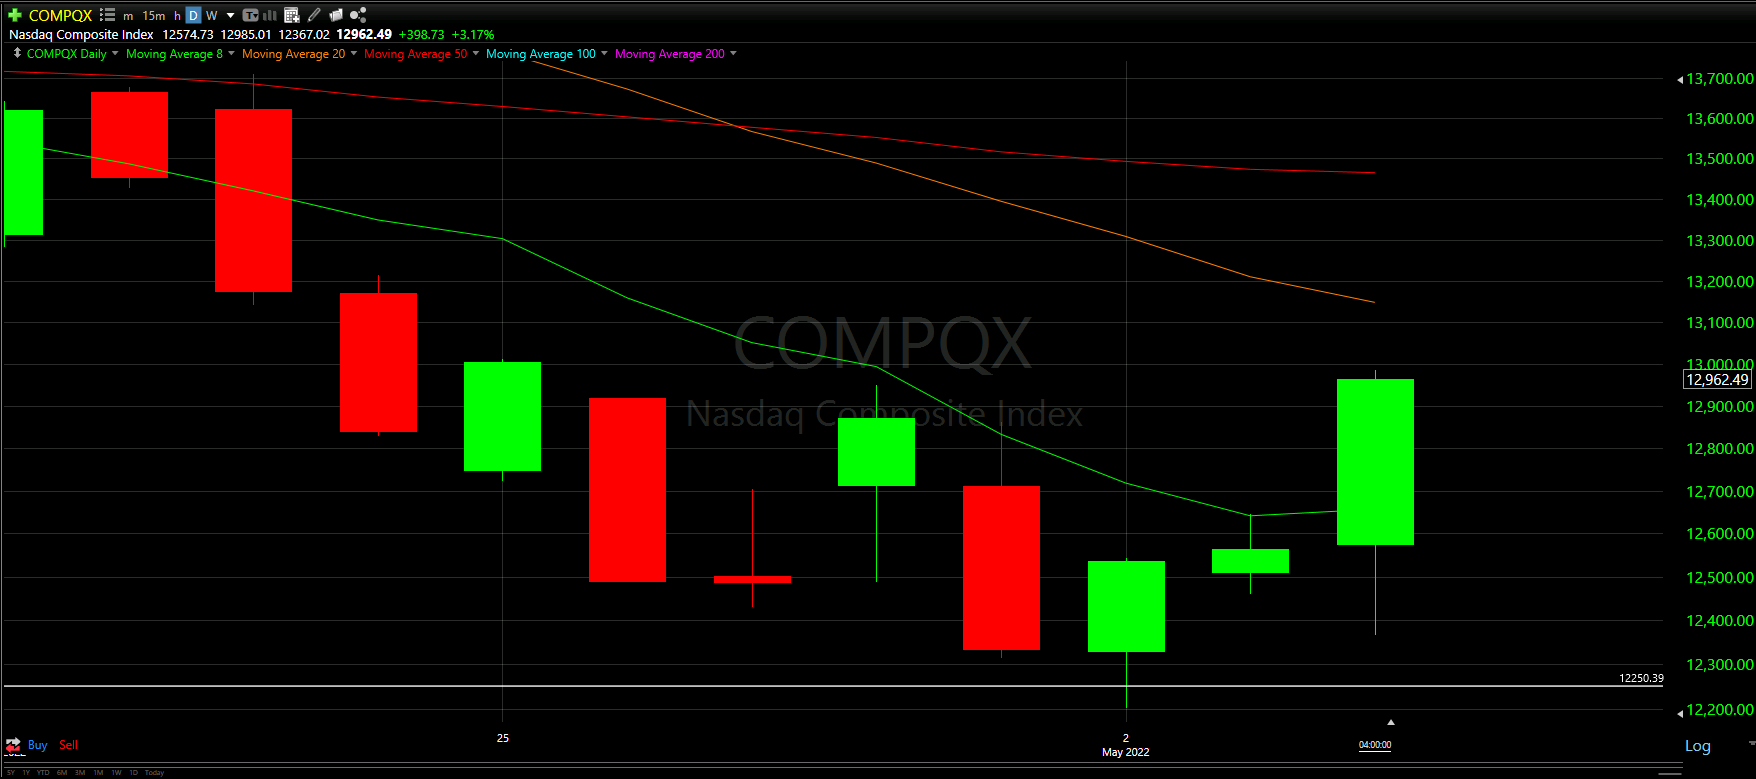
My, my, my! Clearly, the NASDAQ was able to knock out the only immediate need from yesterday’s predictions.
For the first time in 10 trading days, the NASADAQ closed over the 8 Moving Average line in green!
Unlike the Dow Jones, there is some breathing room between the 50 Moving Average in red and 20 Moving Average in orange. Getting over a single Moving Average in 1 trading day is hard alone, but two stacked on top of each other essentially at the same place is even harder. This separation may help the NASDAQ create a steady and gradual climb back up.
Clearly, the Support Line we hit 2 days ago started the bounce up, and closing over the 8MA was big.
The question now will be, Can the Dow sustain this bounce?
Bottom Half Analysis
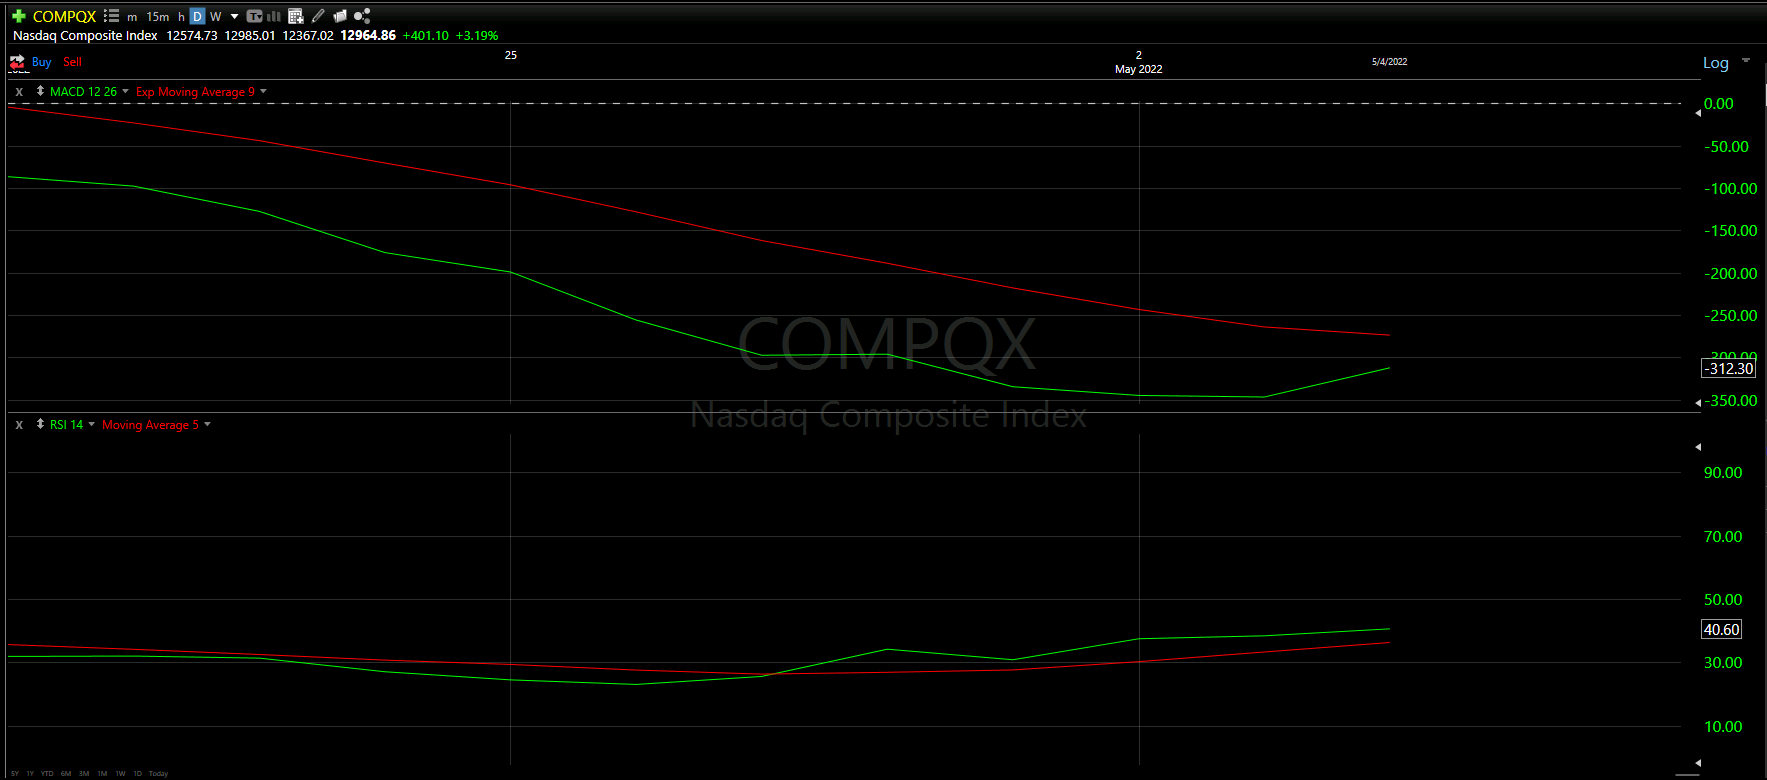
The goal of the Bottom Half analysis is to see a similar story between the MACD and RSI indicators. Ideally both are doing the thing, adding to the confidence of the readings.
Though there is a slight disconnect between the MACD and RSI indicators, they are now at least starting to show a similar sign of potential recovery.
The MACD indicator continues to show the green line well the red line; however, today was a very big pivot up. The slight upward curve we noticed yesterday is clearly forming now.
The RSI indicator continues to show the green peaking above the red line, but it does not seem to be separating as much as the RSI for the Dow Jones.
Overall, the Bottom Half analysis is better than yesterday. However, we really want BOTH the MACD and RSI to have the green line over the red. One more big day for the NASDAQ Composite could help make that happen.
Hourly Analysis
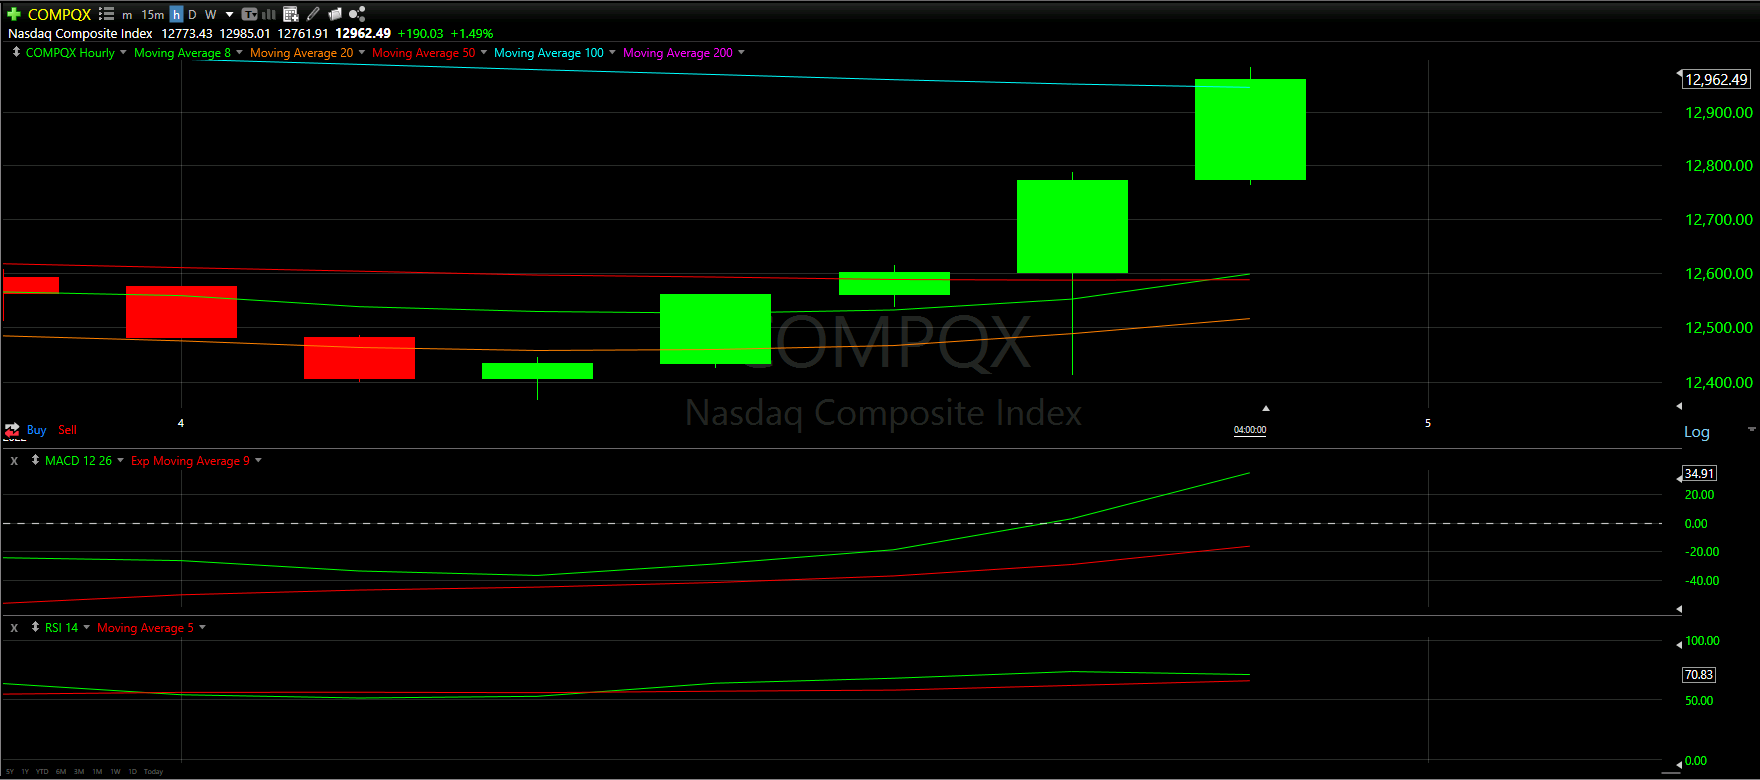
The NASDAQ hourly chart would have scared off most seasoned day traders, to say the least.
The first 3 hours seemed to give a scary sign for the day ahead. Very quickly we lose the 8 Moving Average and 20 Moving average, with nothing left below to catch the fall.
However, the final 5 hours of trading really propelled the day - accomplishing the same as the Dow Jones by closing over the 8MA, 20MA, 50MA, and 100MA all the way at the top.
The MACD has a nice divergence between the green and red lines; however, the RSI seems to show a different story, with what looks like a diminishing green/red cross.
Overall, the positivity from the Moving Average lines seems to show a nice set up to the start of tomorrow, but that RSI should not be ignored for what could be another slow start to the hourly chart.
Final Thoughts and Targets
Before we completely disregard our fears and caution, there is a big need going into tomorrow: Sustaining!
It is easy to have a good day, but to sustain it would actually help remove the slight caution we have given the overall rough conditions we are in.
At this point, we want to start surpassing the upcoming Moving Average line - the 20MA in orange.
The worst things that could happen are: 1. We close under the 8MA or 2. We close under 50% of today’s green candle
Good luck trading!
Don’t forget to check out the Free Knowledge Center to refresh the basics or learn more about Technical or Fundamental Analysis