May 5th Recap as well as May 6th Predictions
What to Expect in Today’s S&P-500 Analysis
With the fourth trading day of May completed, let us see how the day unfolded and what to expect tomorrow.
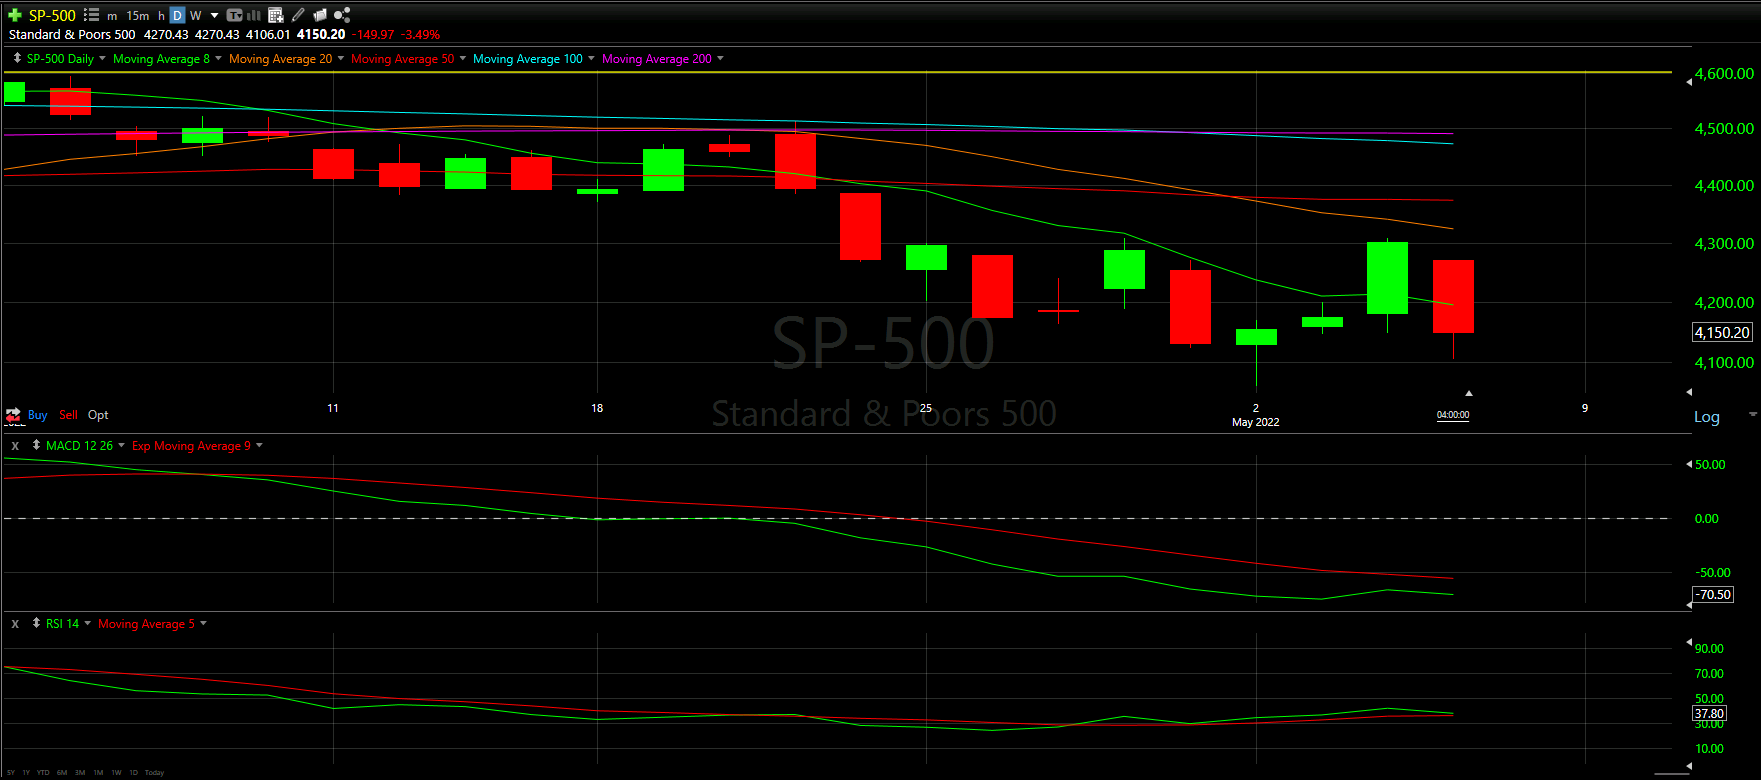
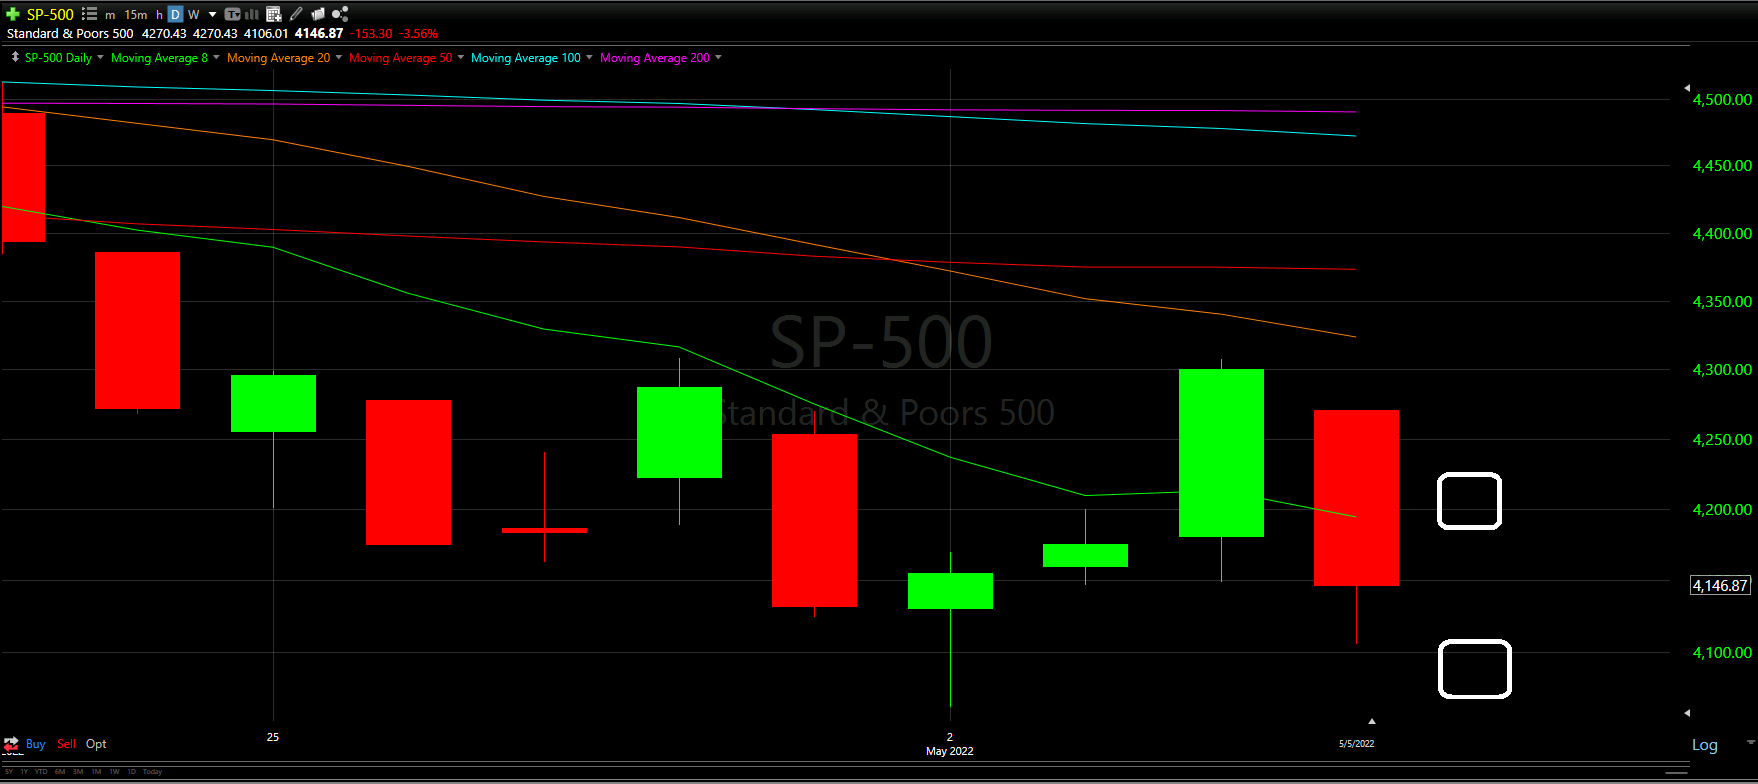
Above you will see the full view of the Daily chart; Top and Bottom indicators included.
As always, we will start by analyzing the Top Half of the Daily chart; seeing how our horizontal Support and Resistance Lines played out during the day, reviewing the Moving Averages that came into play as well as comparing previous candles.
From there, we will analyze the Bottom Half of the Daily chart to see what the momentum looks like going into tomorrow with the additional MACD and RSI indicators.
Ultimately, we will use the combined data to help predict the movement of the S&P-500 for tomorrow.
Top Half Analysis
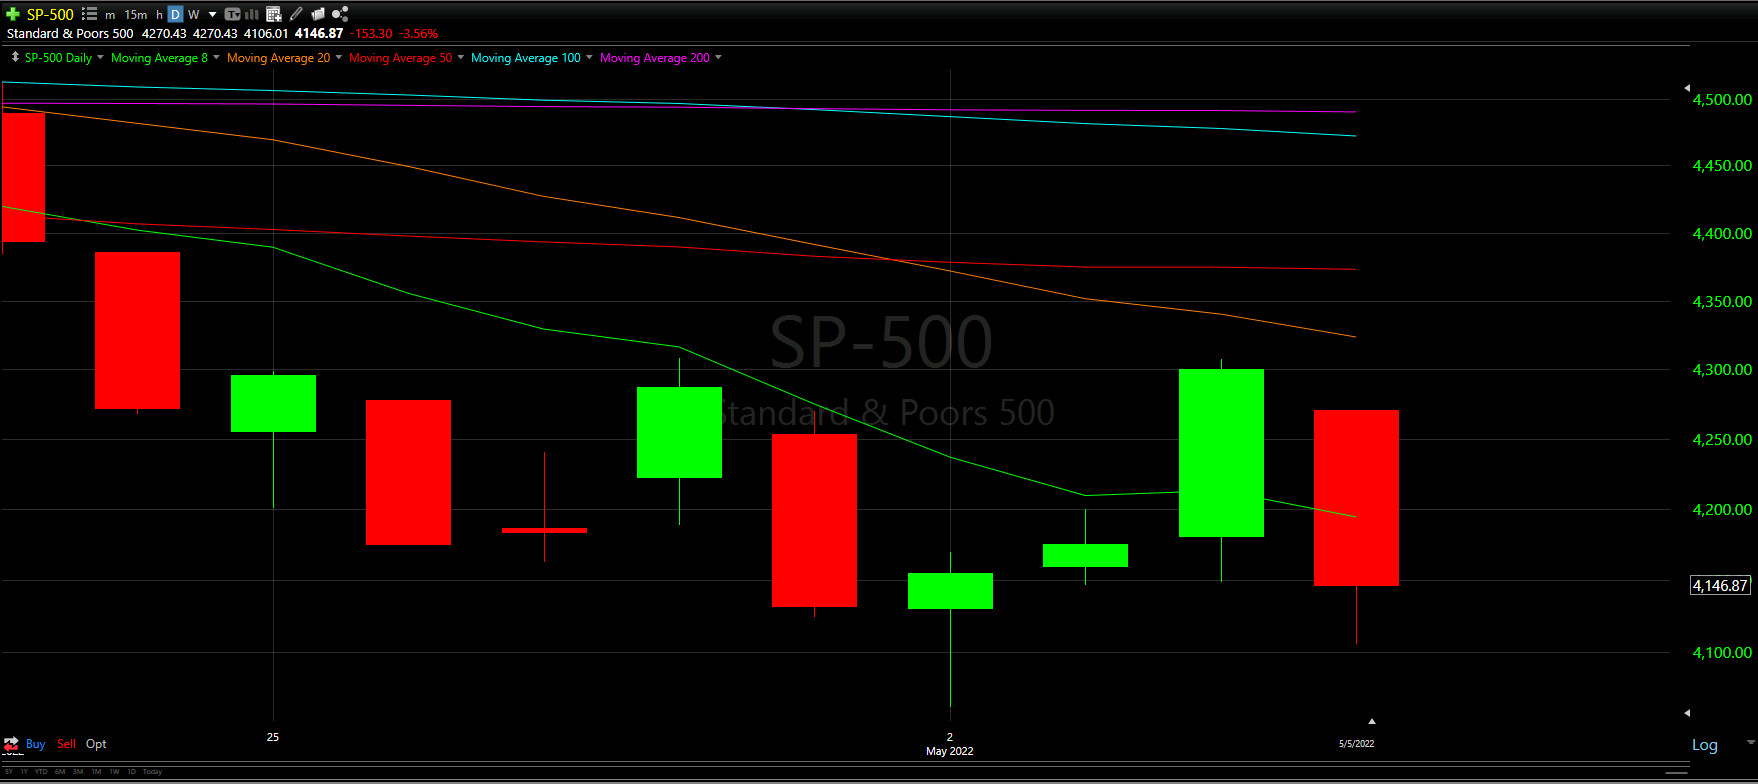
Yesterday’s predictions stressed the importance of keeping some fear and caution despite the 3 green days in a row.
Today we clearly see why!
In one day, the deep red loses took away days of gains for many; however, The Chart Readers hope you were able to trade with a plan instead of being blindsided by the day.
Though yesterday was the first time the S&P-500 closed above the 8 Moving Average line in green, the key was seeing if we could sustain the victory. With the looming combination of the 20 Moving Average and 50 Moving Average lines just above, simply maintaining the 8MA line way key.
But just like that, we lose both 50% of yesterday’s green candle as well as the 8MA! Ouch!
With no Support Line anywhere near, the S&P-500 closed well below the last 2-days. The S&P-500 drop may be harder than the Dow Jones and NASDAQ unless we get to a Support Line soon.
Unless there is some optimistic hope in the Bottom Half Analysis, losing 50% of yesterday’s green candle as well as the 8MA was a deadly blow to this minor 3-day bounce.
Bottom Half Analysis
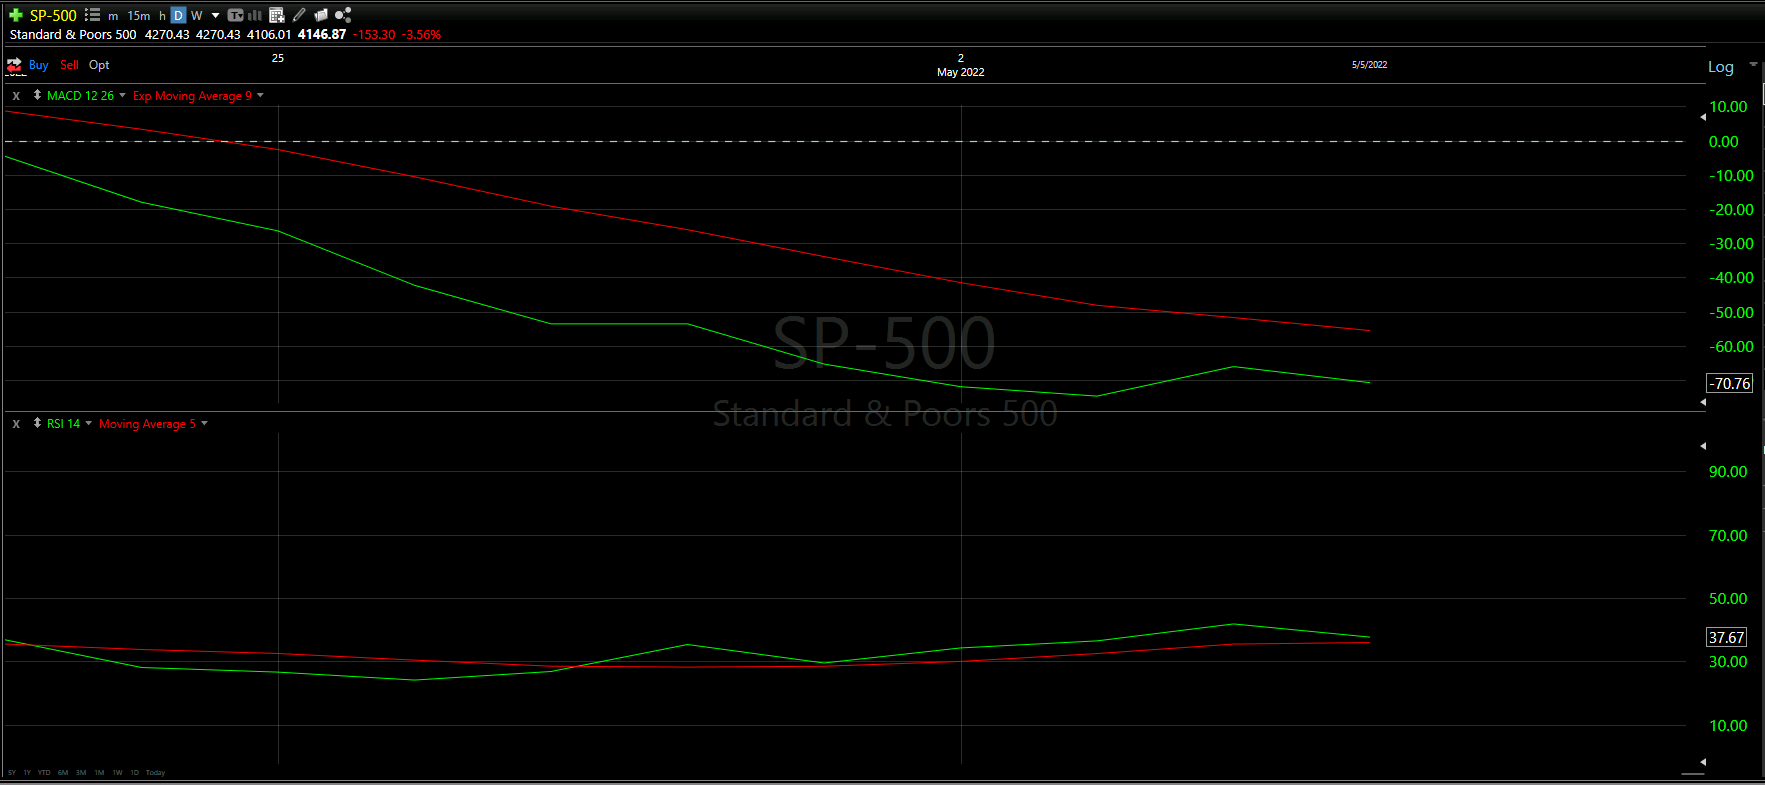
The goal of the Bottom Half analysis is to see a similar story between the MACD and RSI indicators. Ideally both are doing the thing, adding to the confidence of the readings.
Unlike the Dow Jones and NASDAQ, the MACD and RSI continue to show different reading as the green line is under one but over the other.
Clearly the RSI looks like it may be going under, just like the other major markets; however, for now, this is this single positive reading on this entire S&P-500 Daily Analysis
As quickly as yesterday’s excitement came, today’s Bottom Half analysis destroyed most of the remaining hope of a continued bounce upward.
Hourly Analysis
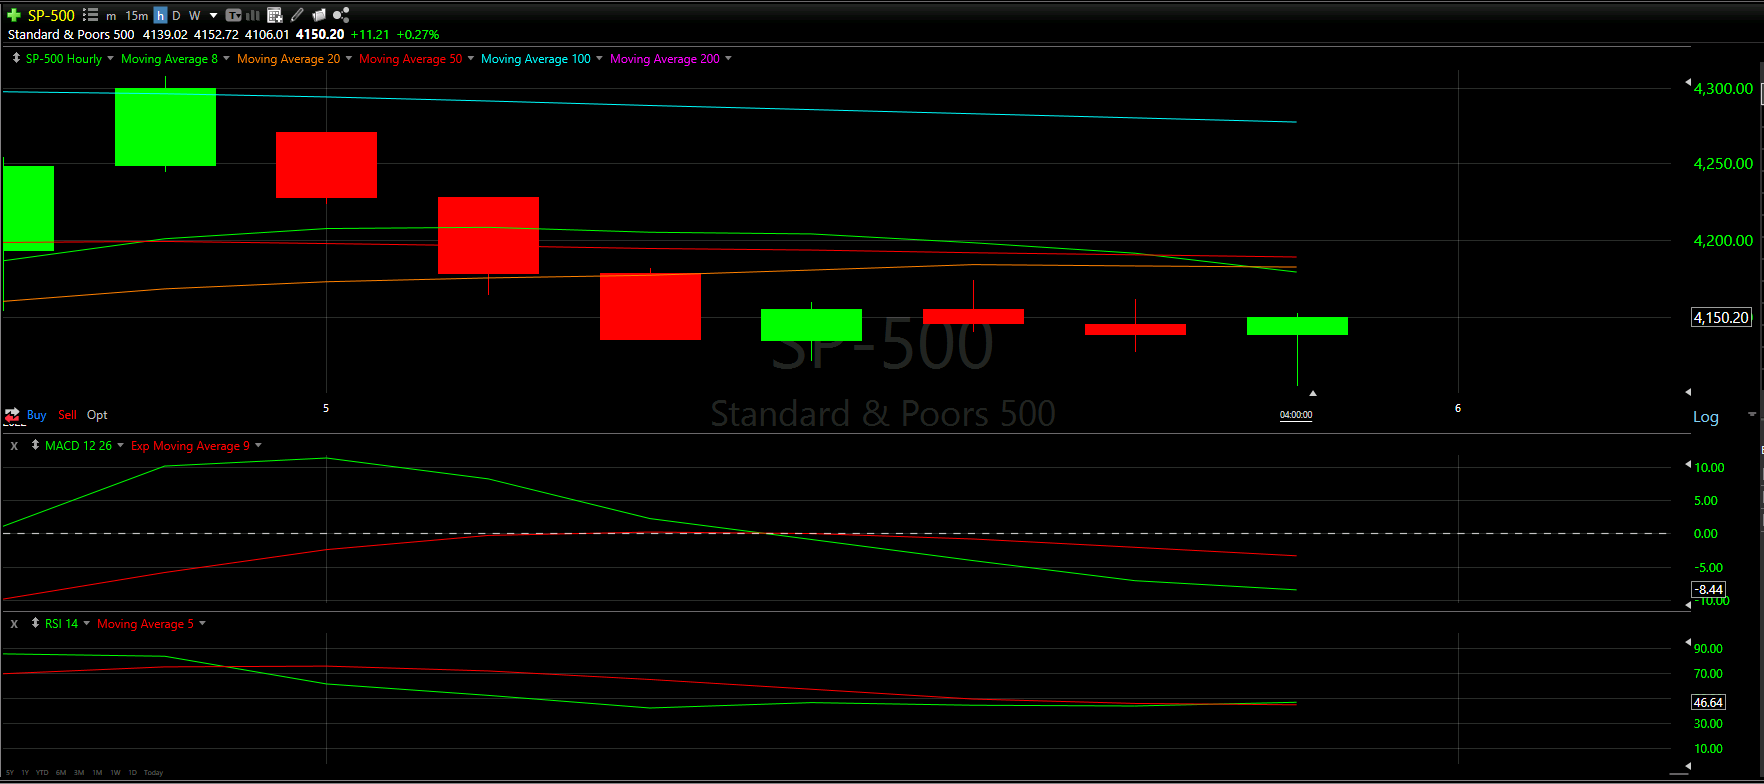
The first 3 hours of the trading day were devastating to say the least.
All the Hourly Moving Average lines we closed above yesterday were lost today!
We are now under all in this Hourly view.
The MACD is still lagging, but there seems to be a nice upward curve forming on the RSI indicator.
However, that “death cluster” of Moving Average lines around the $33.3k range seem far too difficult to break.
Final Thoughts and Targets
By doing both of yesterday’s worst things possible, the S&P-500 is back into the hard downtrend for now.
With no immediate Support Line around, more than likely, the S&P-500 drops to roughly 50% of the long wick from 4-days ago.
The best outcome for tomorrow would be to climb back up and recapture (close above) the 8 Moving Average line.
Fear and caution should be at the forefront of the mind!
Good luck trading!
Don’t forget to check out the Free Knowledge Center to refresh the basics or learn more about Technical or Fundamental Analysis