January 10th Recap and 11th Predictions
What to Expect in this Analysis
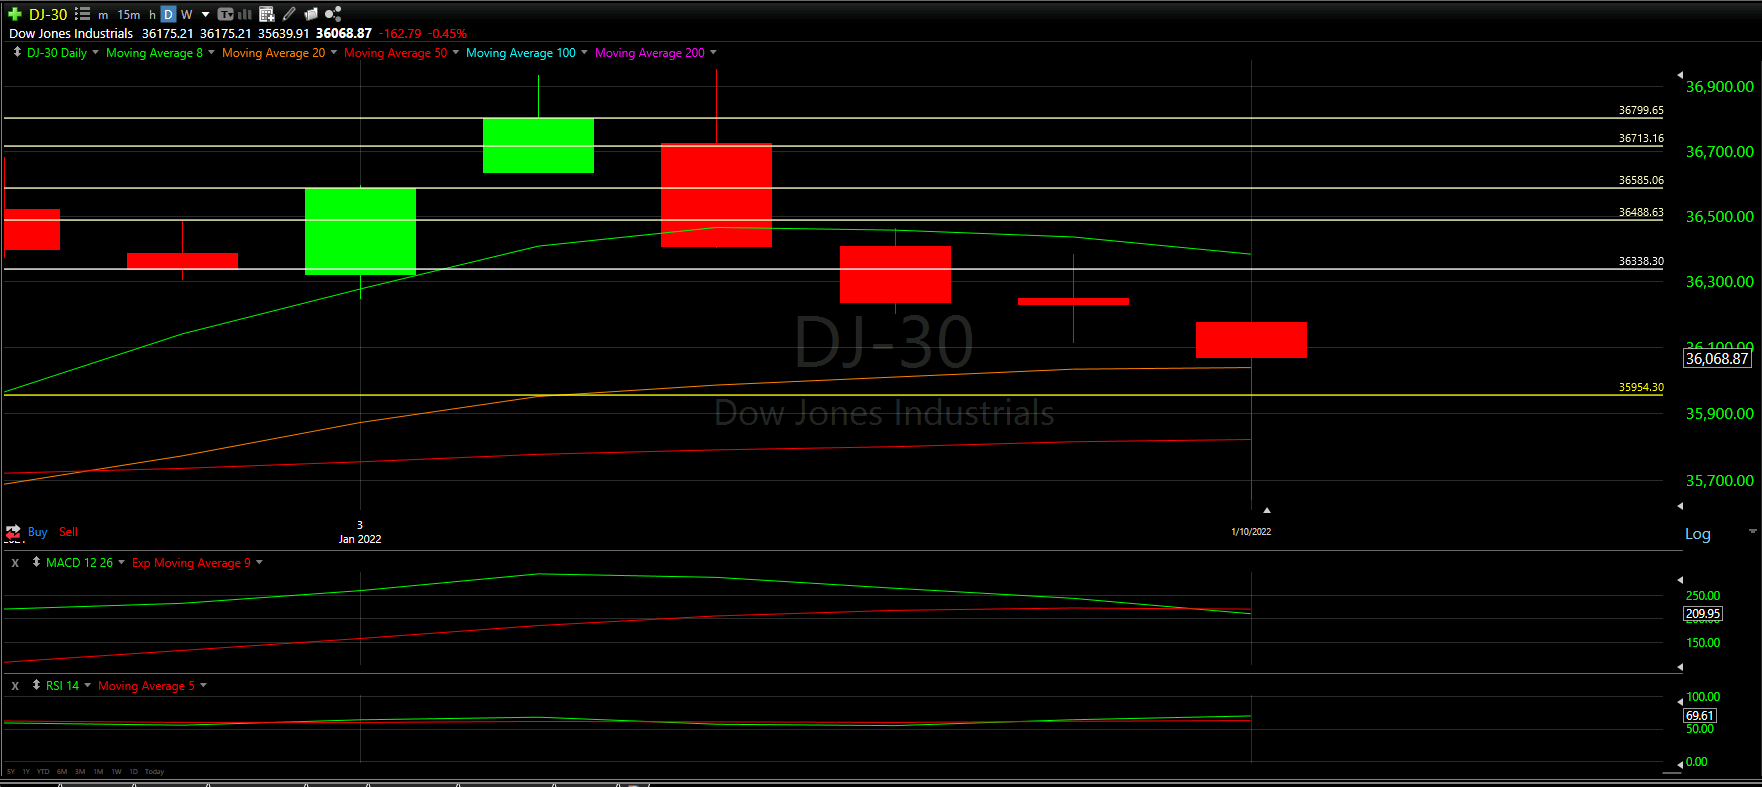
With the sixth trading day of January completed, let us see how the day played out and what to expect tomorrow. Above you will see the full view of the Daily chart. Top and Bottom indicators included.
As always, we will start by analyzing the Top Half of the Daily chart; seeing how our horizontal Support and Resistance Lines played out during the day, reviewing the Moving Averages that came into play as well as comparing previous candles
From there, we will analyze the Bottom Half of the Daily chart to see what the momentum looks like going into tomorrow with the additional MACD and RSI indicators.
Ultimately, we will use the combined data to help anticipate the movement of the Dow Jones for tomorrow.
Top Half Analysis
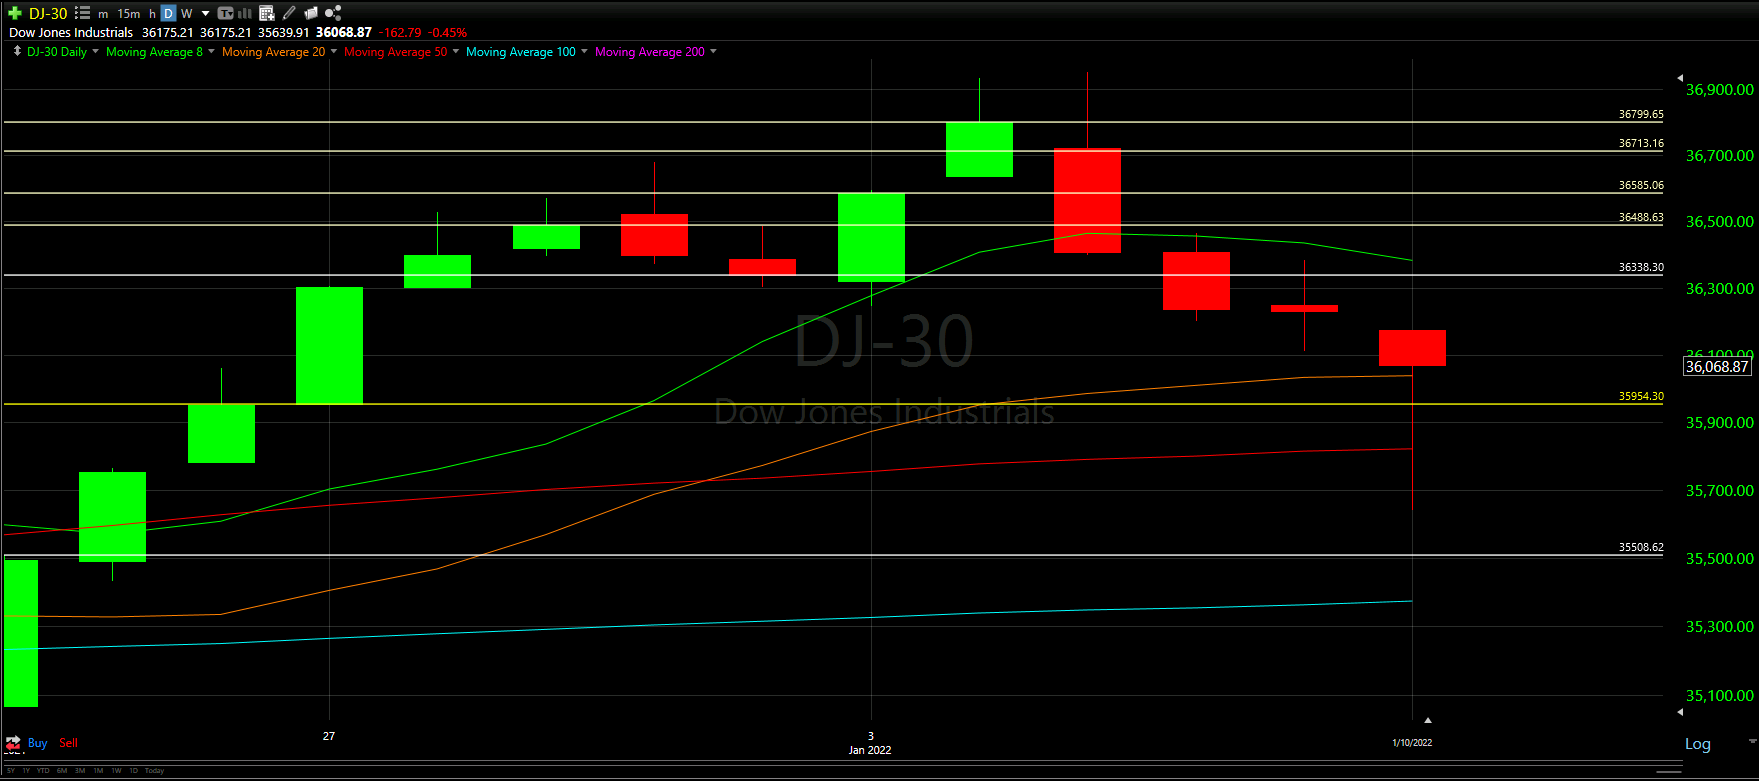
Today we will start our Top Half Analysis by looking at the Candles
One of the first things you should note is long the wick at the bottom of the candle was. We will see that play out in the hourly review below, but what the candle shows is the Dow Jones wanted to tank today, but instead, it shoot up and closed much higher than it would have otherwise.
Is this a sign that things may be changing or was this simply a quick fake-out before harder drops come?
Looking at the Moving Averages, we can see that the Dow Jones is now testing the 20 Moving Average. We did close above the 20 Moving Average; however, we can see that the wick went lower than the 50 Moving Average line before coming back up. The hope here is that we bounce up from this 20 Moving Average
No new Support lines were added to our chart, but it looks like our newest line in Yellow is still holding the support for now.
Bottom Half Analysis
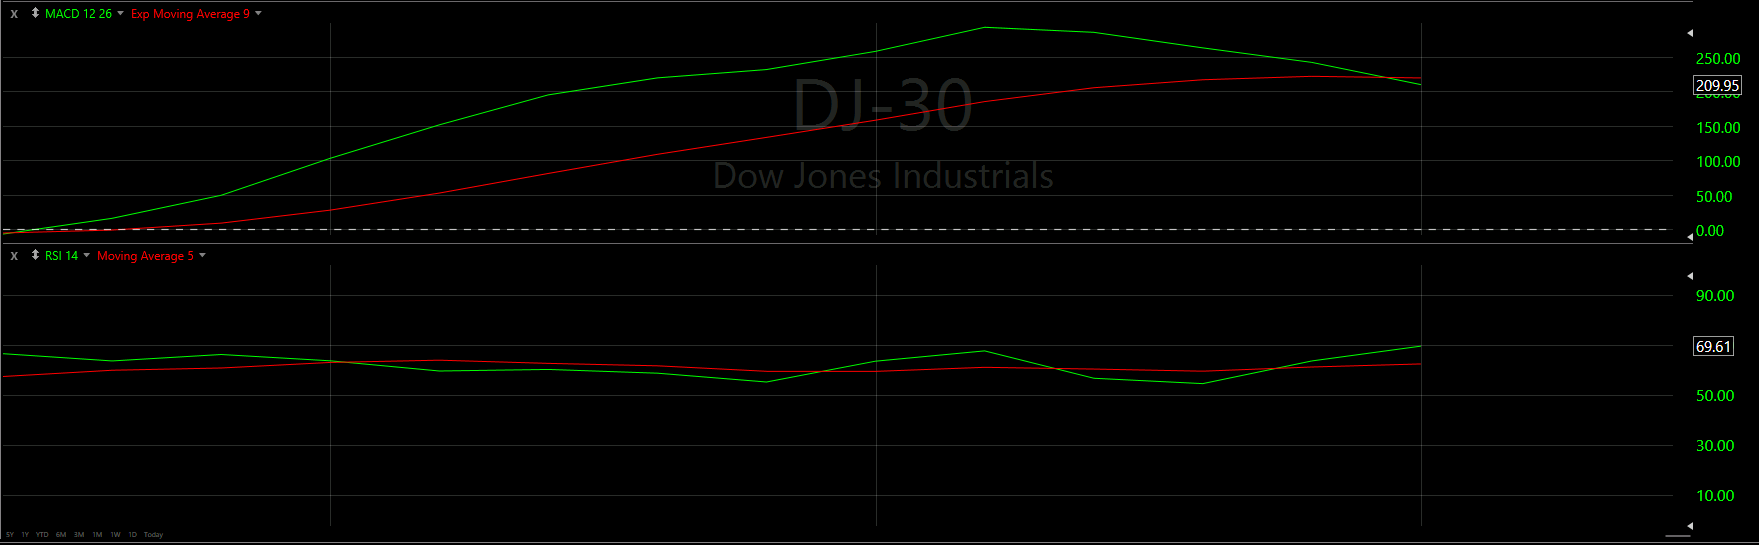
It seems there is a bit of contradictory information with out two momentum indicators - the MACD and RSI
The MACD is indicating that the momentum is still negative - emphasized by the fact that the Green line is under the Red line. It seems the Green line is on a downward trajectory too, so this indicator seems to show that the momentum is not going well.
On the contrary, the RSI indicator is showing a potential positive shift in momentum. We can see the Green line is over the Red line, and there seems to be a nice gap between the two lines.
Hourly Analysis

The start of the morning was a bit worrisome, with the first 2 hours tanking.
The second hour even closed below our 200 Moving Average line, which is never a good thing.
However, it seemed the 200 Moving Average provided enough support for a bounce up.
The 3rd and 4th hour hovered just above the 200 Moving Average just before a nice uptrend started at the end of the day.
What is even better, the last hour closed above the 8 Moving Average and our horizontal Support line.
This should help the morning start better, but it is how the day ends that always counts!
Final Thoughts and Targets
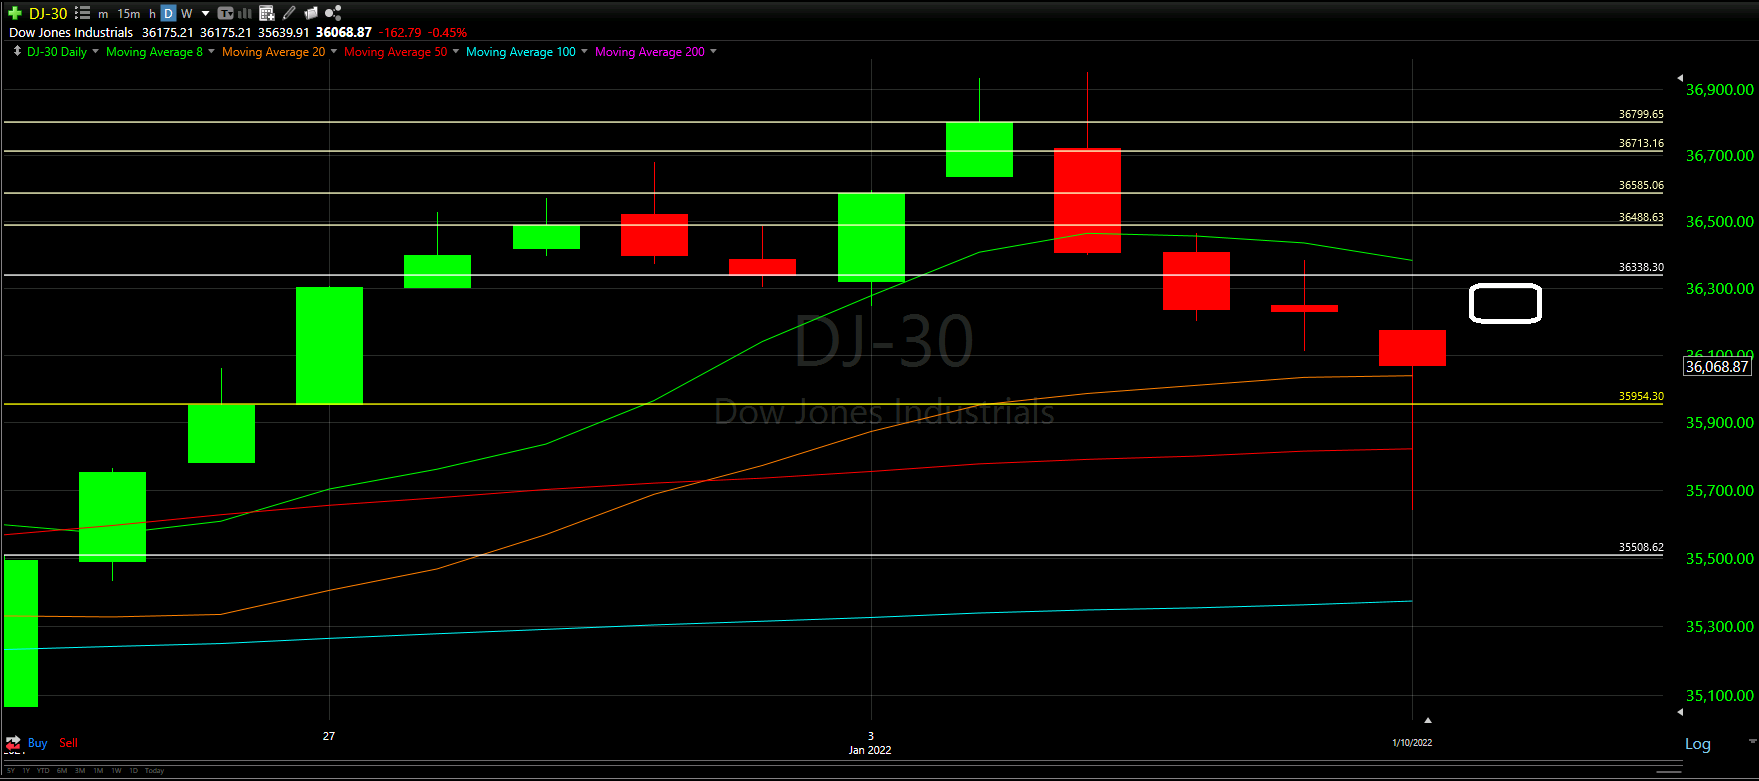
There is some hope that the Dow Jones may recover tomorrow; however, there was far too much uncertainty to make any sort of confident moves.
The hourly chart seemed to indicate a positive start to the morning; however, our momentum indicators were just a bit too inconclusive.
What will be most important for tomorrow is closing above the 20 Moving Average again and starting the climb to get over the 8 Moving Average as well, as shown in the white rectangle above.
The last thing we want to happen is we close below the 20 Moving Average! That would be a sign of more trouble for the immediate future
Good luck trading!