January 11th Recap and 12th Predictions
What to Expect in the Analysis Below

With the seventh trading day of January completed, let us see how the day played out and what to expect tomorrow.
Above you will see the full view of the Daily chart, Top and Bottom Half indicators included.
As always, we will start by analyzing the Top Half of the Daily chart; seeing how our horizontal Support and Resistance Lines played out during the day, reviewing the Moving Averages that came into play as well as comparing previous candles.
From there, we will analyze the Bottom Half of the Daily chart to see what the momentum looks like going into tomorrow with the additional MACD and RSI indicators.
Ultimately, we will use the combined data to help predict the movement of the Dow Jones for tomorrow.
Top Half Analysis
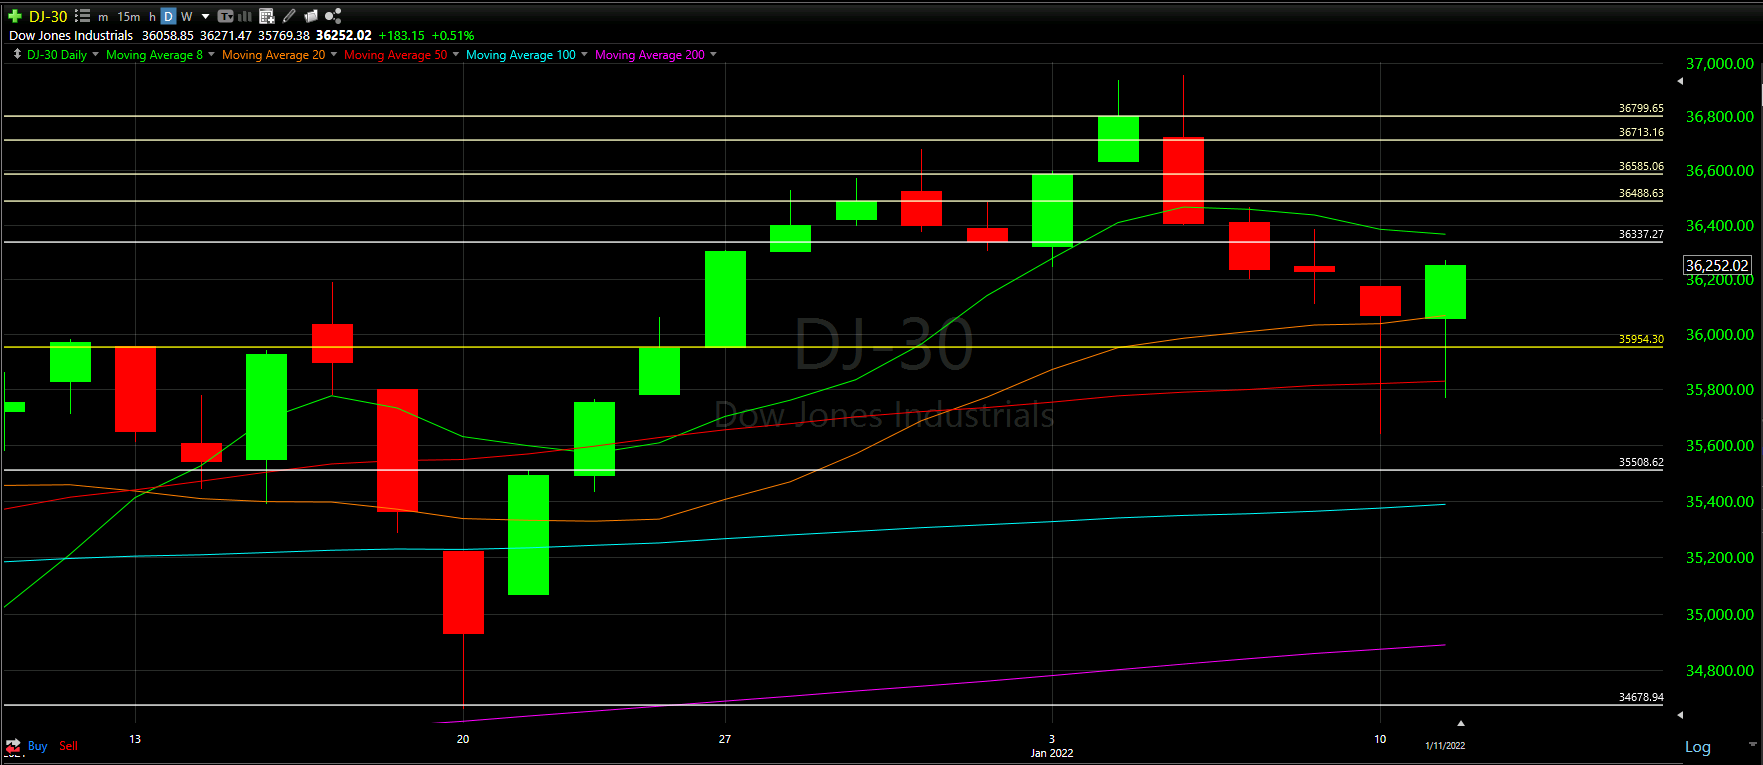
Today we will start our Top Half Analysis by looking at the Candles
The great thing to see is that the candle finished just about where we were hoping in yesterday’s predictions. It would have been nicer to see us close above the Support line just under $36,400; however, overall, not too shabby!
Back to back days we see a long wick at the bottom of the candle - the potential selloff was once again gone before the day ended. Just like yesterday, we will see this in more detail below during the Hourly Chart Review.
Yesterday we asked “Is this a sign that things may be changing or was this simply a quick fake-out before harder drops come?” and it seems we may be changing gears a bit.
Our 4 day downtrend seems to have been broken with today’s candle - one more day confirmation would be very reassuring
We discussed the 20 Moving Average yesterday as well, and Boom! - we get a nice bounce up from the 20 Moving Average line just like we hoped. The day pretty much started right on the 20 Moving Average orange line and closed well above.
Maybe we finally get back over the 8 Moving Average line soon?
All in all, great day for the Dow Jones!
Bottom Half Analysis
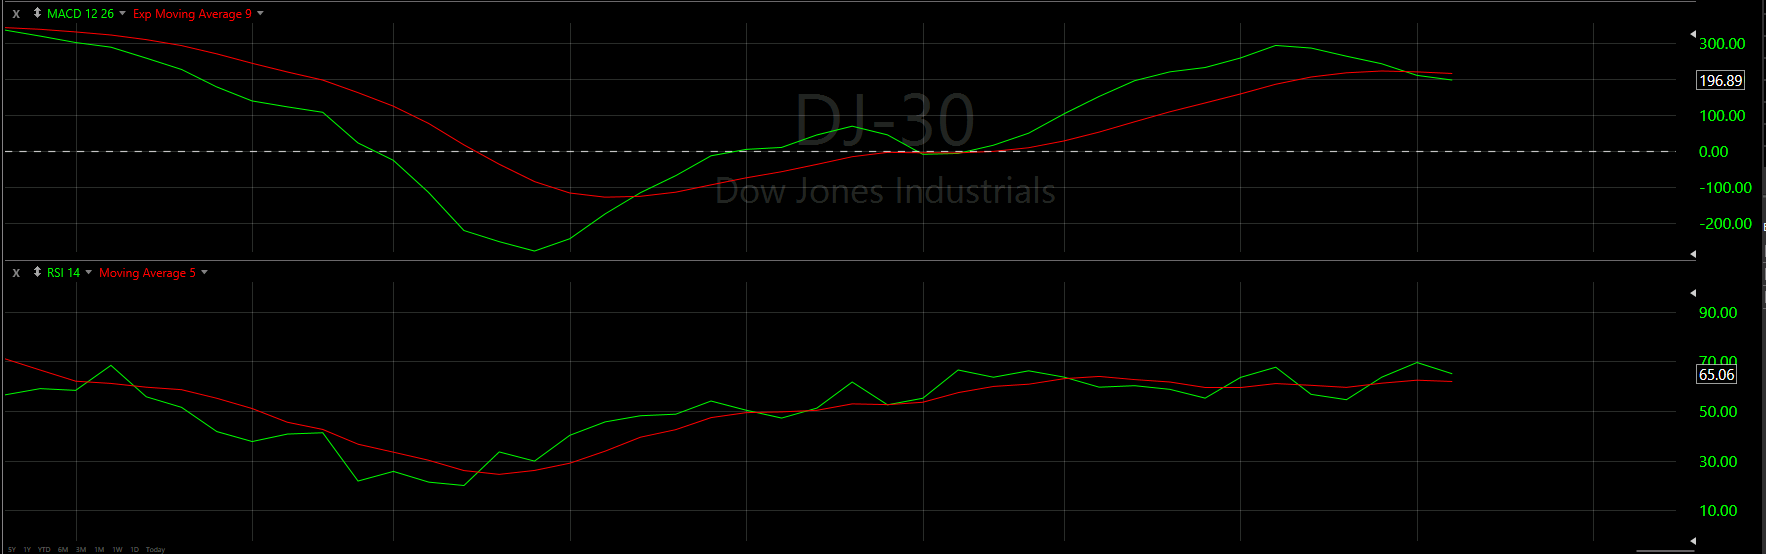
It seems there is a bit of contradictory information with out two momentum indicators - the MACD and RSI. We said that same sentence yesterday; however, the contradiction is different.
The MACD is starting to show the first signs of recovery with what looks like a curl starting to form in the Green line. Will that be strong enough to get us back over the Red line?
What really seems a bit odd is the fact that the RSI went down even though the day went up. That alone makes it worrisome that the positive day today was nothing more than a fake momentum push. If the RSI’s gas is about to decline, can the Dow Jones actually follow up with another good day?
It is only 1 indicator, but that single Green line decline during a positive day seems to be speaking a mouthful.
Ideally it is an over-worry, but never a bad thing to be too cautious.
Hourly Analysis

Yesterday our thought was that the morning would start positive; however, that clearly was not the case.
The first hour closed below the 8 Moving Average but above the 200 Moving Average.
It seemed the 200 Moving Average line in purple was enough to save the first hour from dropping too far down and let the second hour recover all the way back up to the 8 Moving Average line.
From there, it was 5 hours of positive trading for the Dow Jones!
Got to love an hourly chart like that!!
Final Thoughts and Targets
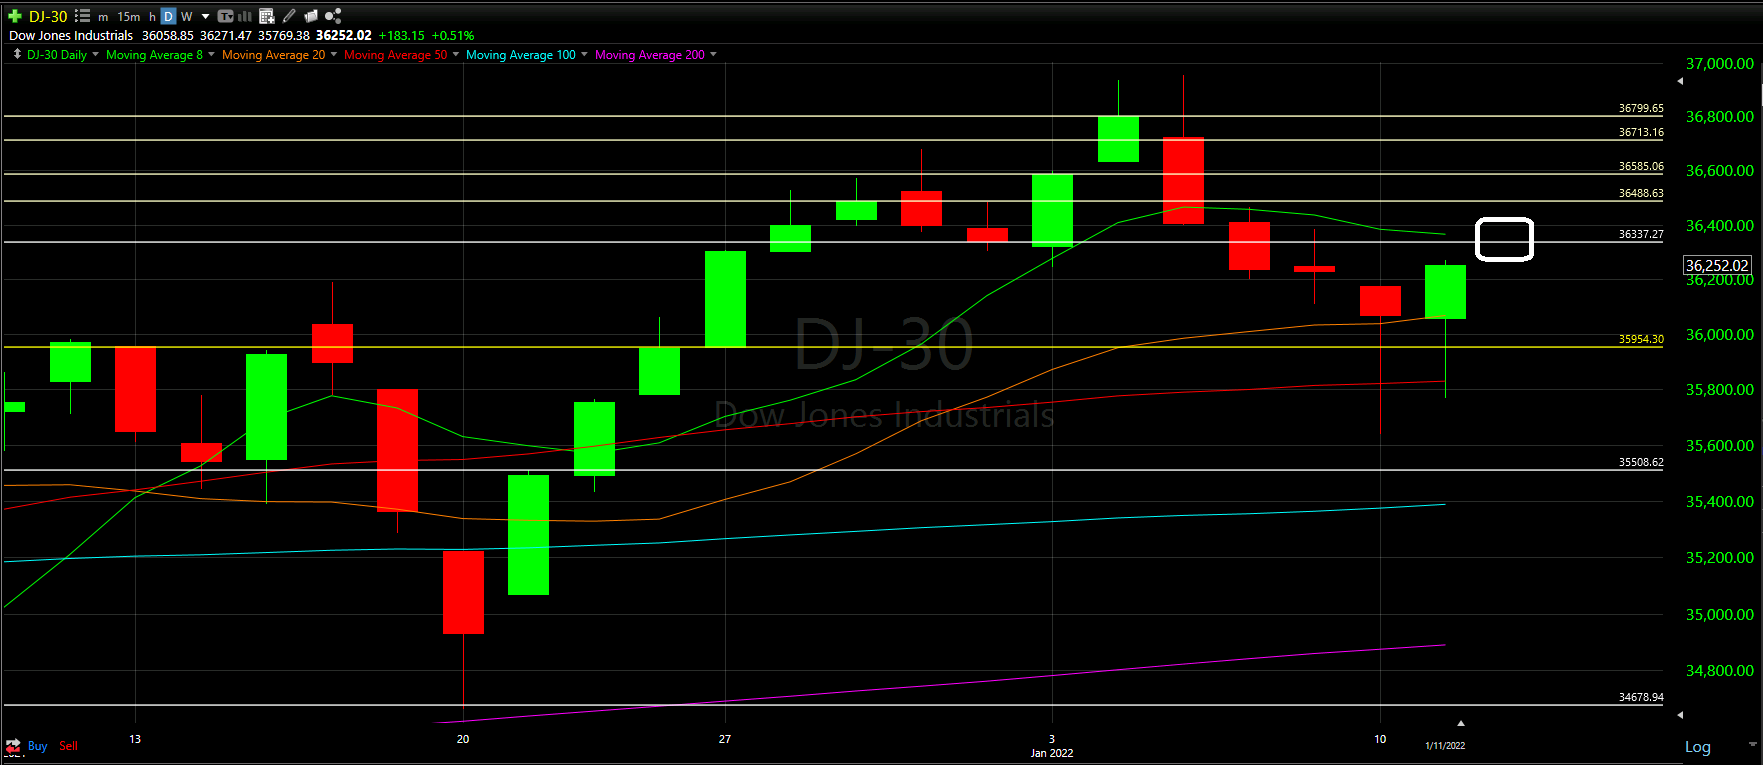
Tomorrow will be a very telling day for the Dow Jones.
There is more optimism than fear in the Daily and Hourly chart analysis; however, the RSI indicator seemed to be a rather odd outlier.
If the day goes well, the goal will be to close at or above the Support line and 8 Moving Average line that seem to be heading around the same area tomorrow.
The worst thing that could happen is we lose more than 50% of today’s candle and continue a downtrend
Here is hoping we curve upward!
Good luck trading!
Don’t forget to check out the Free Knowledge Center to refresh the basics or learn more about Technical or Fundamental Analysis