January 6th Recap and 7th Predictions
What to Expect in this Analysis
With the fourth trading day of January completed, let us see how the day played out and what to expect tomorrow.
As we will always do, the first thing to be reviewed will be Top Half of the Daily chart. We will see how the horizontal Support and Resistance Lines played out during the first day, as well as review the Moving Averages that came into play.
From there, we will look at the Bottom Half of the Daily chart to see what the momentum looks like going into tomorrow with the additional MACD and RSI indicators.
Top Half Analysis
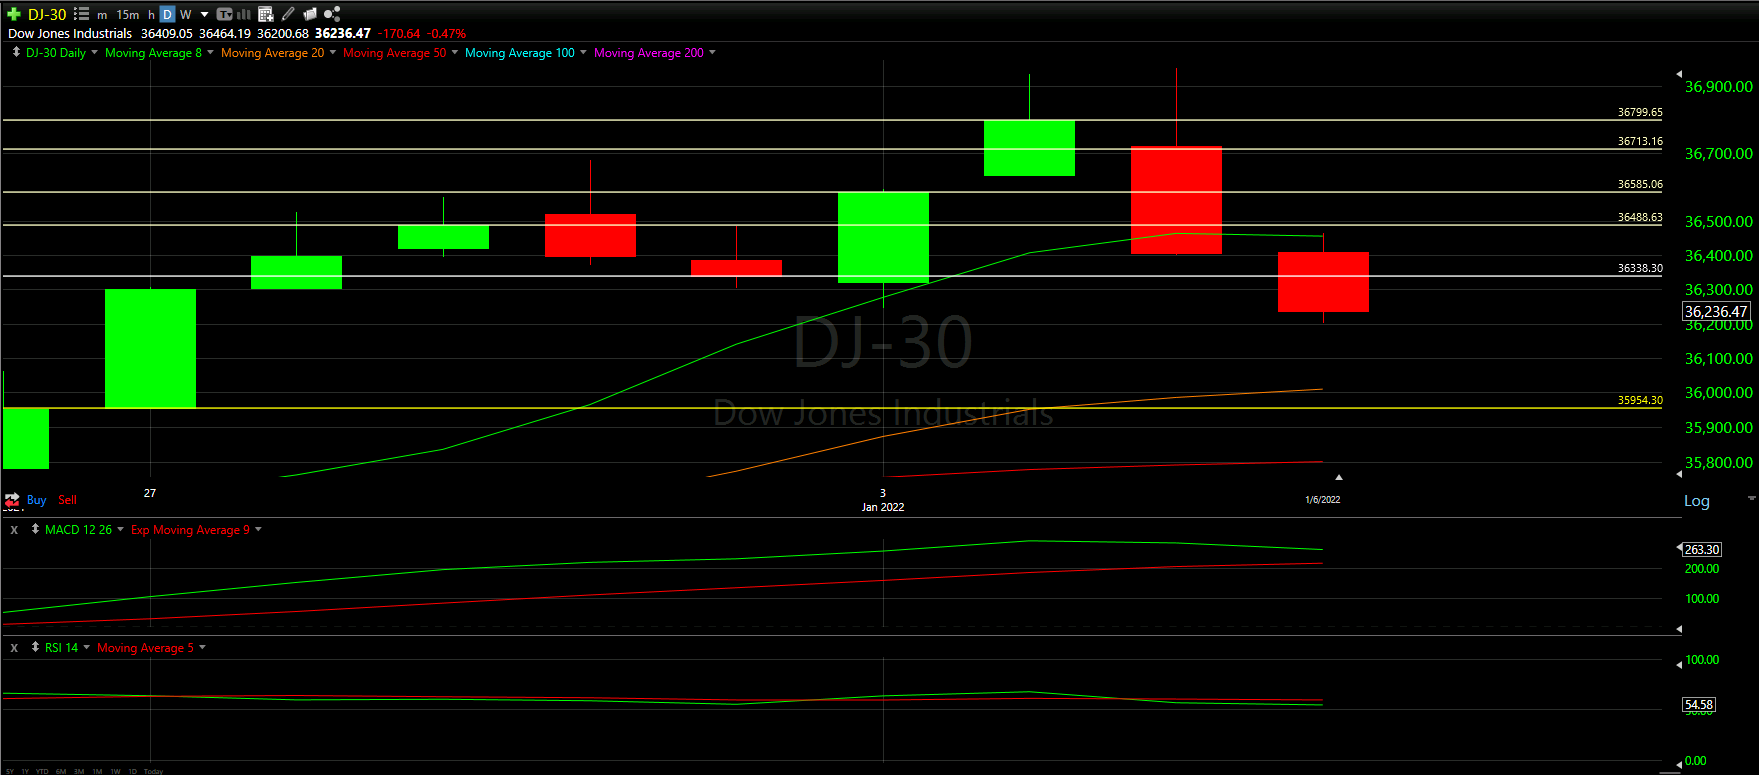
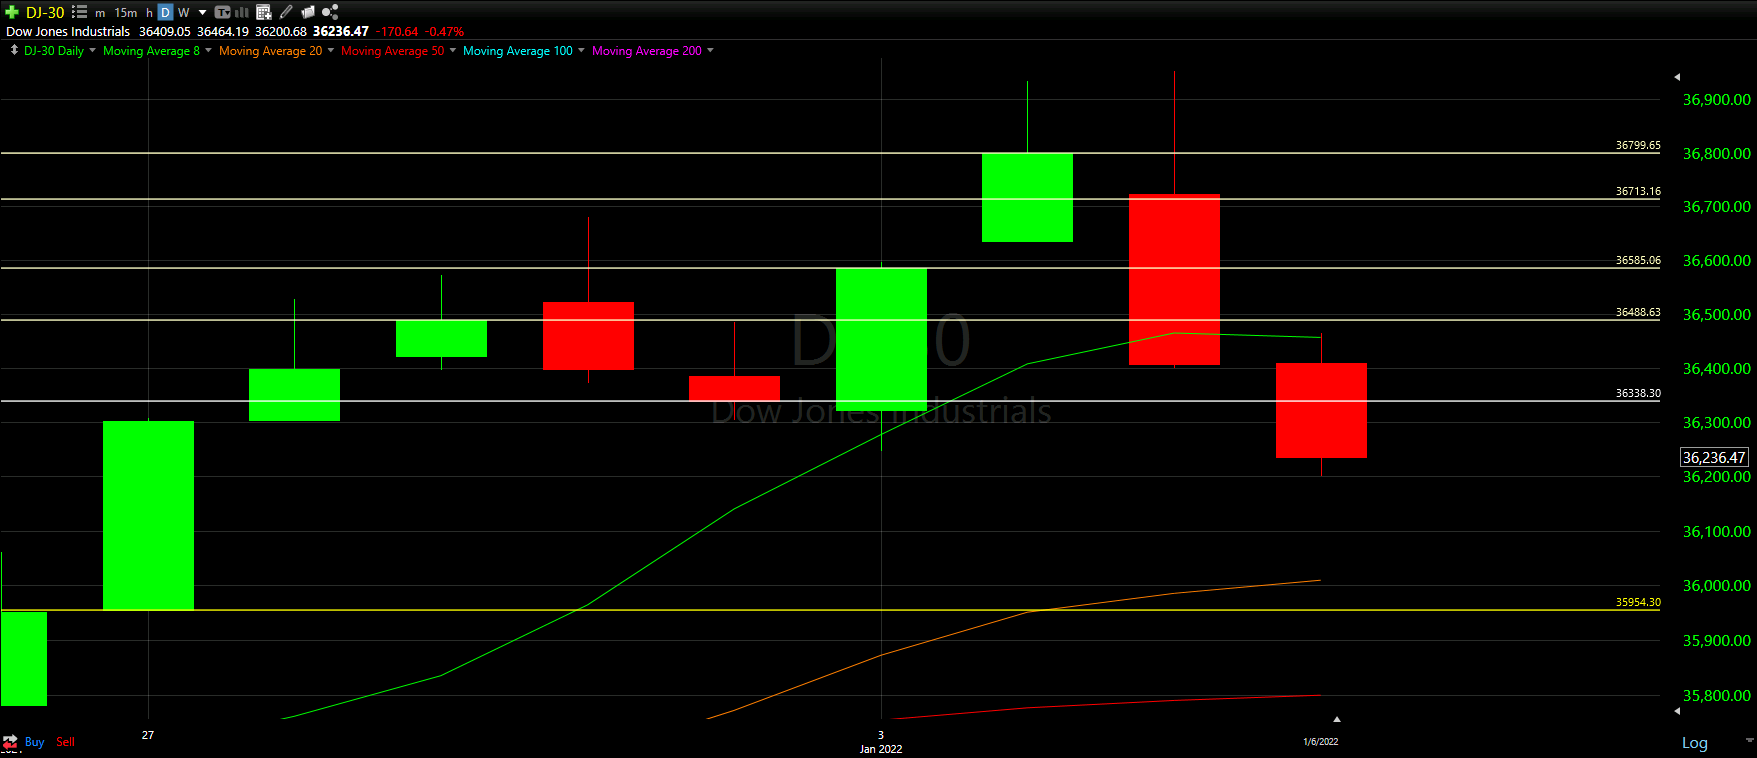
The first thing to notice is that we have now lost all our Support lines near the all time highs and are starting to drop to the newer, lower, Support lines we have been drawing. This will be very common, especially when looking at short term charts like a Daily, Hourly, or so on from the month. Never be afraid to adjust as long as you can keep track of short term vs long term Support lines.
That said, as mentioned, we are now below all our Support lines on top and are heading down to the newest from yesterday, in Yellow at the bottom of the image above. It could be argued that an additional Support line could be drawn in the image above. There is a decent gap between the only two we have in play, and there really isn’t a Moving Average in between we can use. That said, we left the chart as is since yesterday. However, it would be no surprise if we see a bounce around $36,150.00
Aside from losing the top Supports, we are now clearly trading under the 8 Moving Average. This is always a tough place to be and always brings with it a sense of negativity. Ideally this is short lived; otherwise, we may be testing the 20 Moving Average not too far down below
This was a rather negative Top Half Analysis and we really need to hope for some good news below
Bottom Half Analysis
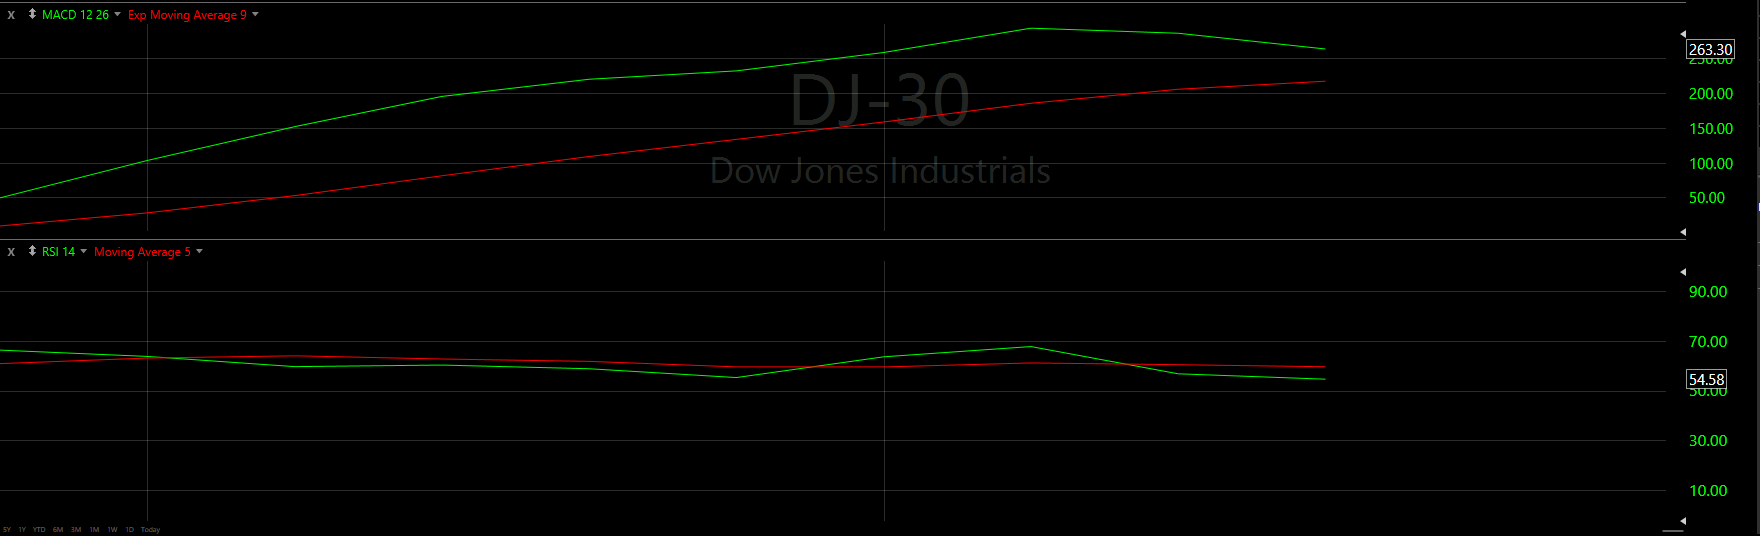
Continuing with yesterday’s trend, the MACD continues to show the Green and Red lines getting closer and closer. We always want Green over Red, and the bigger the distance over Red the better. This upcoming convergence is worrisome.
Unfortunately, the RSI’s Green line now crossed under the Red line and seems to be continuing with this trend. It may still be early, but it looks like the Green lines wants to continue in the downward drop; however, looking back at the line’s history, it seems a small consistent drop may occur as well. We will sit and watch
Just like above, our Bottom Half Analysis brings a lot of concern to the Dow Jones tomorrow.
Hourly Analysis
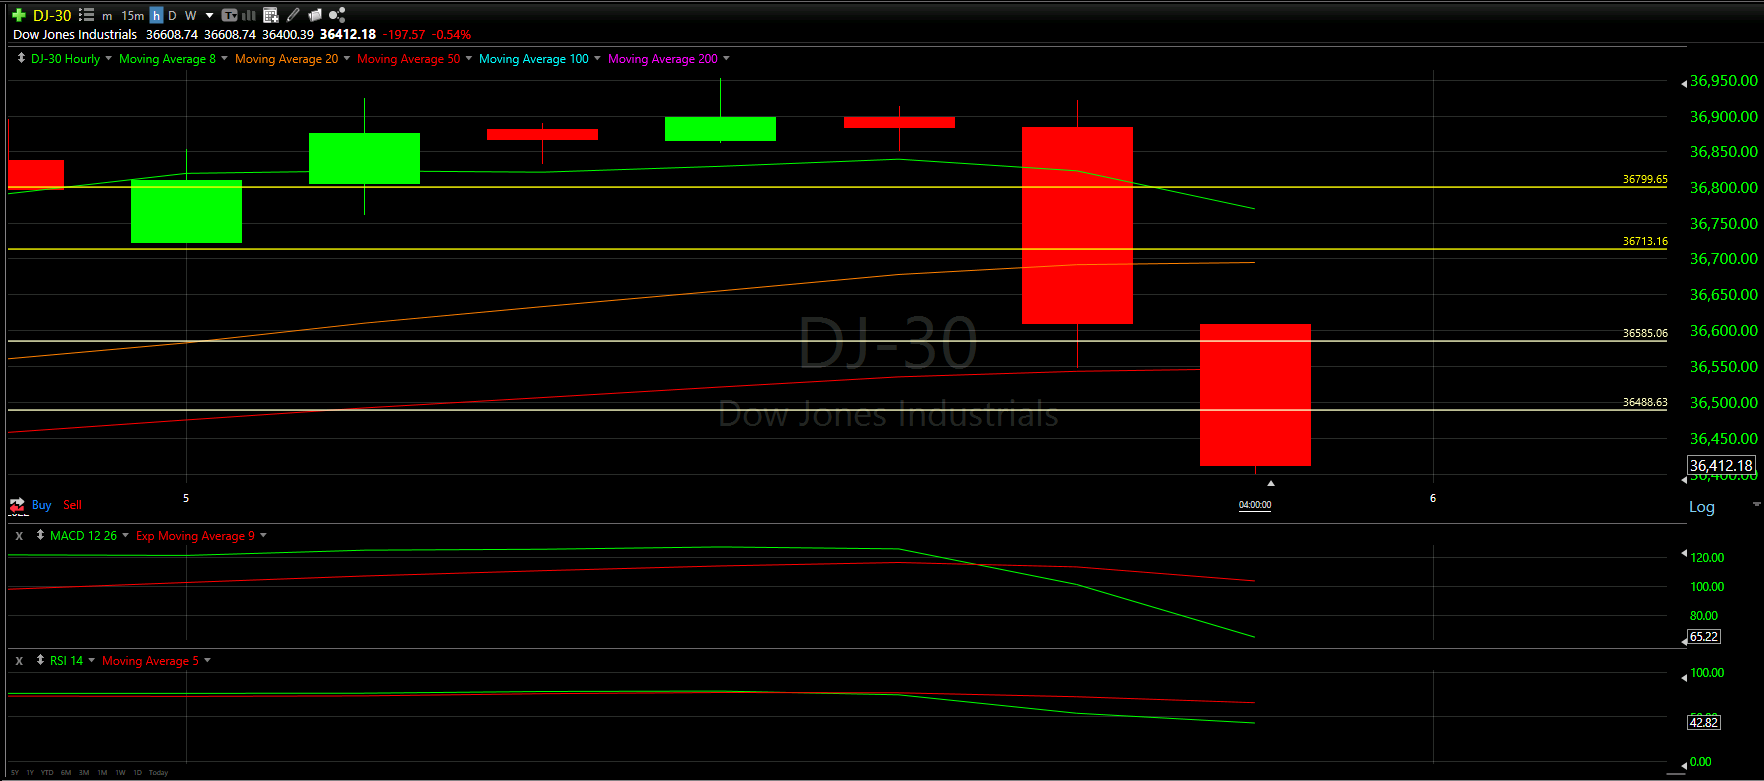
Just like yesterday’s recap, the Hourly chart really could have fooled most skilled traders.
The first 5 hours of trading (more than half the day) would be considered positive - 3 green candles and the only red candles never lost 50% of the previous candle. We even saw 3 consecutive hours trading over the 8 Moving Average from start to close of the candles.
However, the last 2 candles really devistated any attempts at a recovery for the Dow. Four Support lines and four Moving Averages were taken down in a matter of 2 hours. and the MACD and RSI took a hit at the tail end of the Hourly Chart.
Rough!

Final Thoughts and Targets
The Dow has faired well in comparison to the NASDAQ and S&P-500 these last two days. That is why we tend to believe the Dow will see one more day of trouble to keep the coorilation among the Major Markets going.
Ideally we land around the $36,150 range as mentioned above; otherwise, there is a lot of reason to believe we could be going even lower to test the 20 Moving Average on the yellow Support Line
Good luck trading!