January 10th recap and 11th Predictions
What to Expect
With the sixth trading day of January completed, let us see how the day played out and what to expect tomorrow.
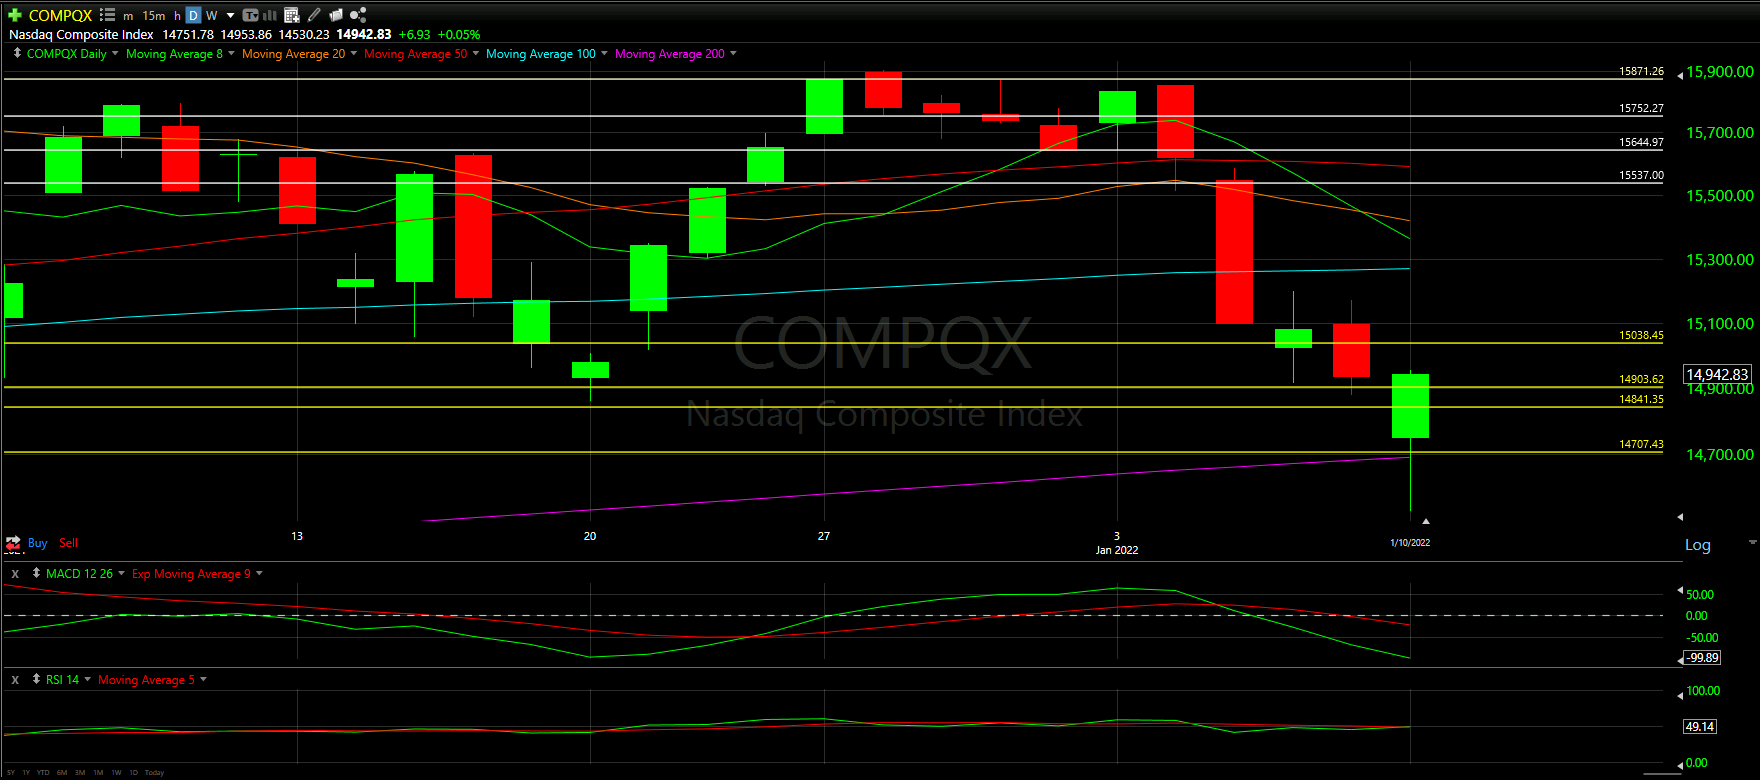
Above you will see the full view of the Daily chart; Top and Bottom indicators included.
As always, we will start by analyzing the Top Half of the Daily chart; seeing how our horizontal Support and Resistance Lines played out during the day, reviewing the Moving Averages that came into play as well as comparing previous candles
From there, we will analyze the Bottom Half of the Daily chart to see what the momentum looks like going into tomorrow with the additional MACD and RSI indicators.
Ultimately, we will use the combined data to help anticipate the movement of the NASDAQ for tomorrow.
Top Half Analysis
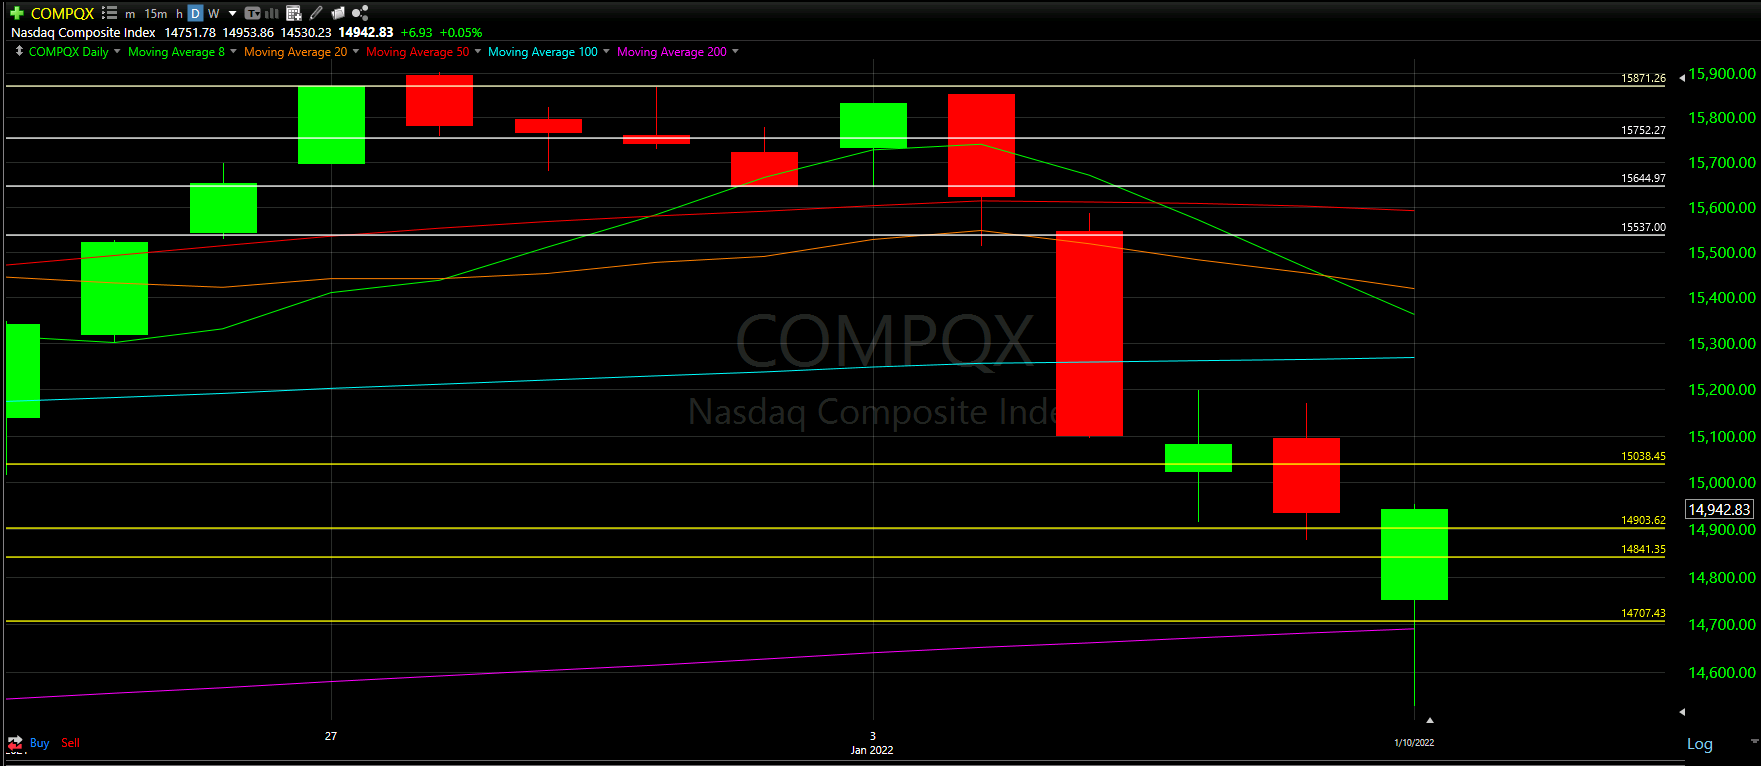
Today was the best day the NASDAQ has seen in over 10 days of trading
We can see today’s candle has a very long wick at the bottom of the chart, meaning there was a moment where the NASDAQ thought about dropping well below our 200 Moving Average line. However, the NASDAQ shot back up, saving what would of been a horrible day. This will be more evident when we look at the hourly chart below.
It is very positive to see that the daily candle was able to close over a few of our newer Support lines. Ideally we can recapture the top Support line in this cluster before working our way over the Moving Averages we are under.
We have not broken this downtrend yet; however, today was a much needed good day.
Bottom Half Analysis
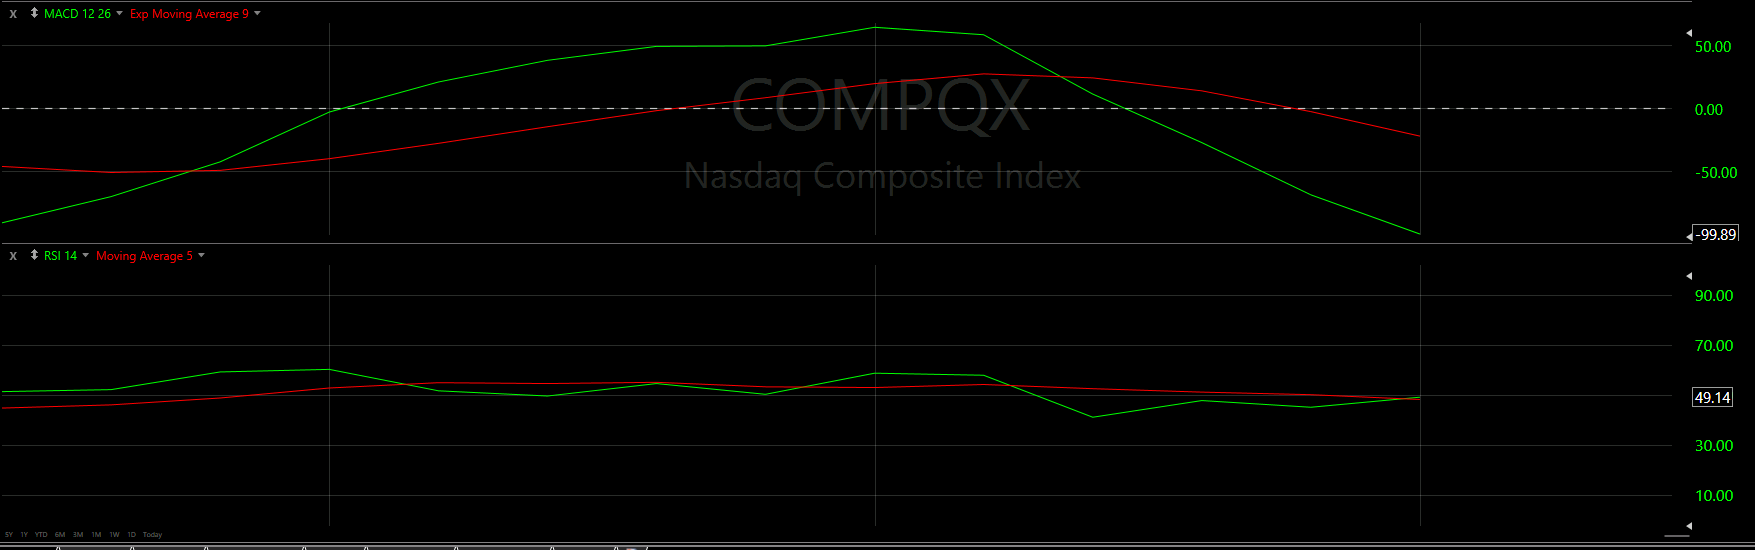
There seems to be a mixed signal in the momentum readings of the MACD and the RSI. Let us take a deeper dive.
Starting with the MACD, the Green line is well below the Red line. It might seem like the Green line is about to begin a curl up; however, clearly, we will need a few more positive days to confirm that. For now, we need the MACD to do a 180 and get that Green line back over the Red, ASAP!
On the other hand, the RSI is starting to show some recovery. Today was the first time in a few trading days that the Green line is back over the Red line. It also seems the Green line has an upward slope to it, so ideally, this trend carries over the next day or two.
Hourly Analysis

Just like the Dow Jones, the first two trading hours were very much negative. That first hour alone was pretty much a selloff the whole time.
It is not until the 3rd hour where the shift starts to begin. The 3rd candle is able to overtake the losses from the 2nd hour, which helped propel the rest of the day. With the 4th hour closing about 50% of the 3rd, that was all the NASDAQ needed to keep the momentum going.
One positive and negative to highlight here:
Positive is that the hourly closed above the 8 Moving Average.
Negative is the hourly was unable to close over the 20 Moving Average. You can see the hourly candle tried and failed, which is why there is a very small wick at the top of the last candle.
Ideally closing over the 8 Moving Average on the hourly is a good start for tomorrow - closing above the 20 Moving Average as well would have been better
Final Thoughts and Targets
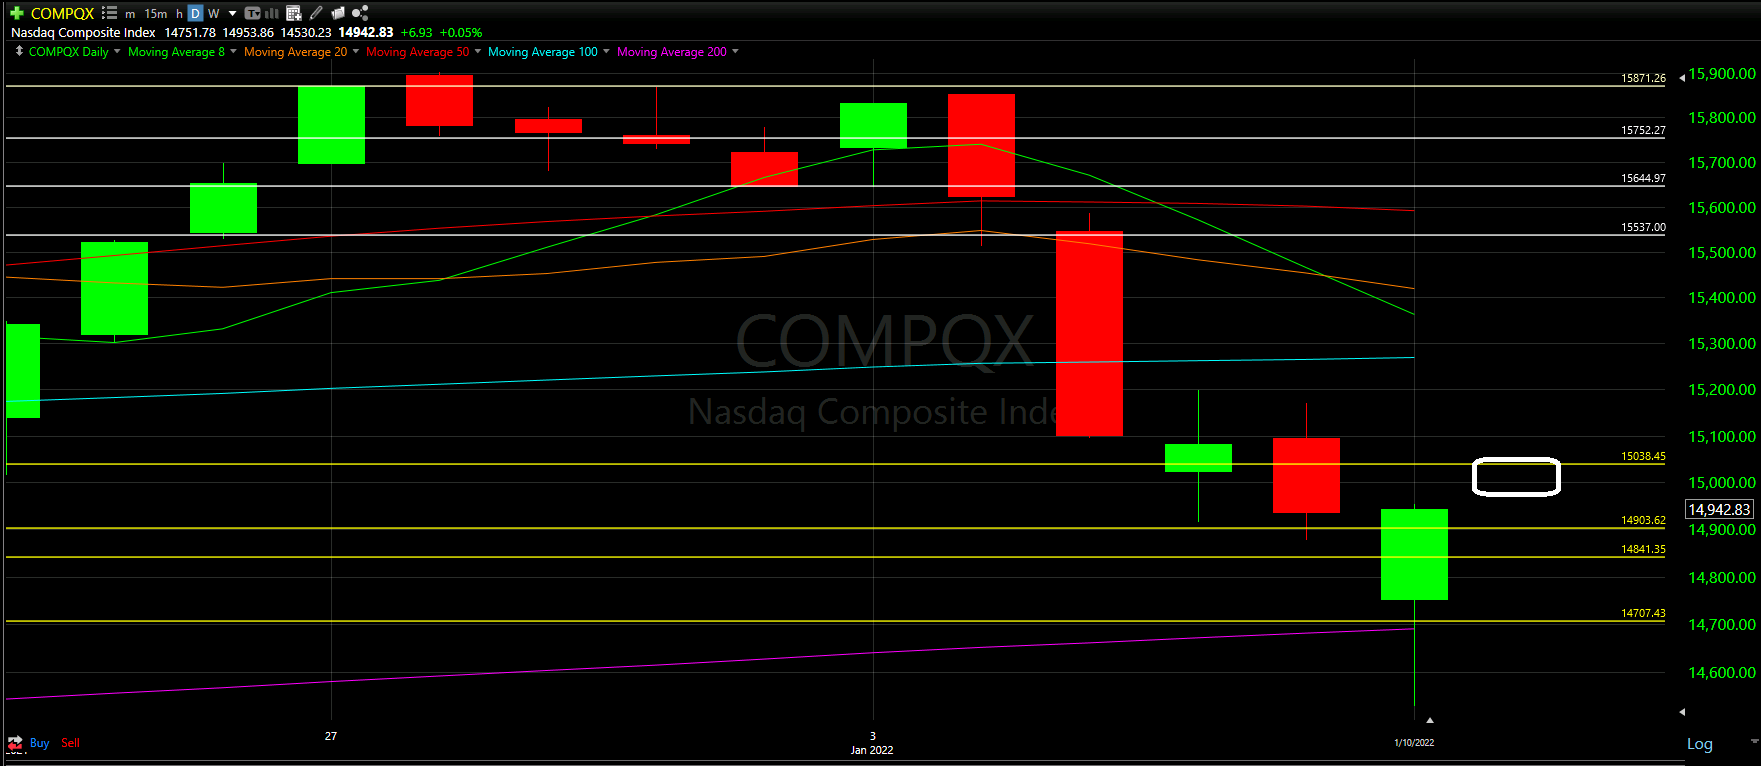
With today being one of the better trading days the NASDAQ has seen in a bit, ideally, that carries into tomorrow as well.
The goal is to close near or over the 50% mark of yesterday’s candle. That would put us just under the top Support line in this bottom cluster.
The worst thing that could happen is we lose all 3 Support lines and the Moving Average line at the bottom of the chart above. If that happens we will need to look at the past data to find new Support lines to track the downtrend.
There are some signs of positivity, but we really need to see what tomorrow shows.
Good luck trading!