January 6th recap and 7th Predictions
What to Expect
With the fourth trading day of January completed, let us see how the day played out and what to expect tomorrow.
As we will always do, the first thing to be reviewed will be Top Half of the Daily chart. We will see how the horizontal Support and Resistance Lines from our January Monthly Prediction played out during the first day, as well as review the Moving Averages that came into play.
From there, we will look at the Bottom Half of the Daily chart to see what the momentum looks like going into tomorrow with the additional MACD and RSI indicators.
Top Half Analysis
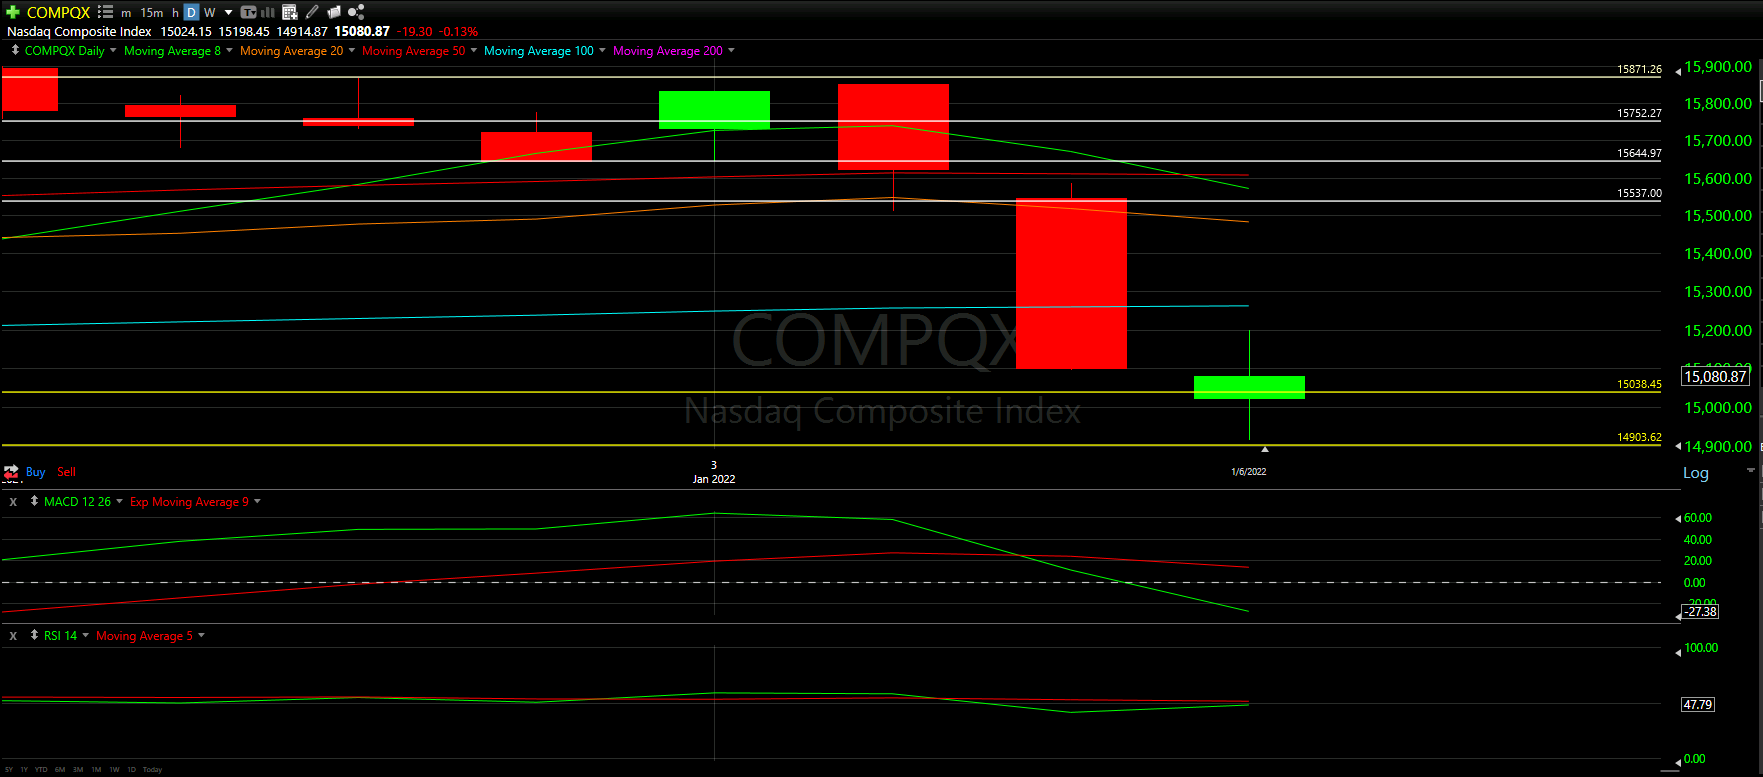
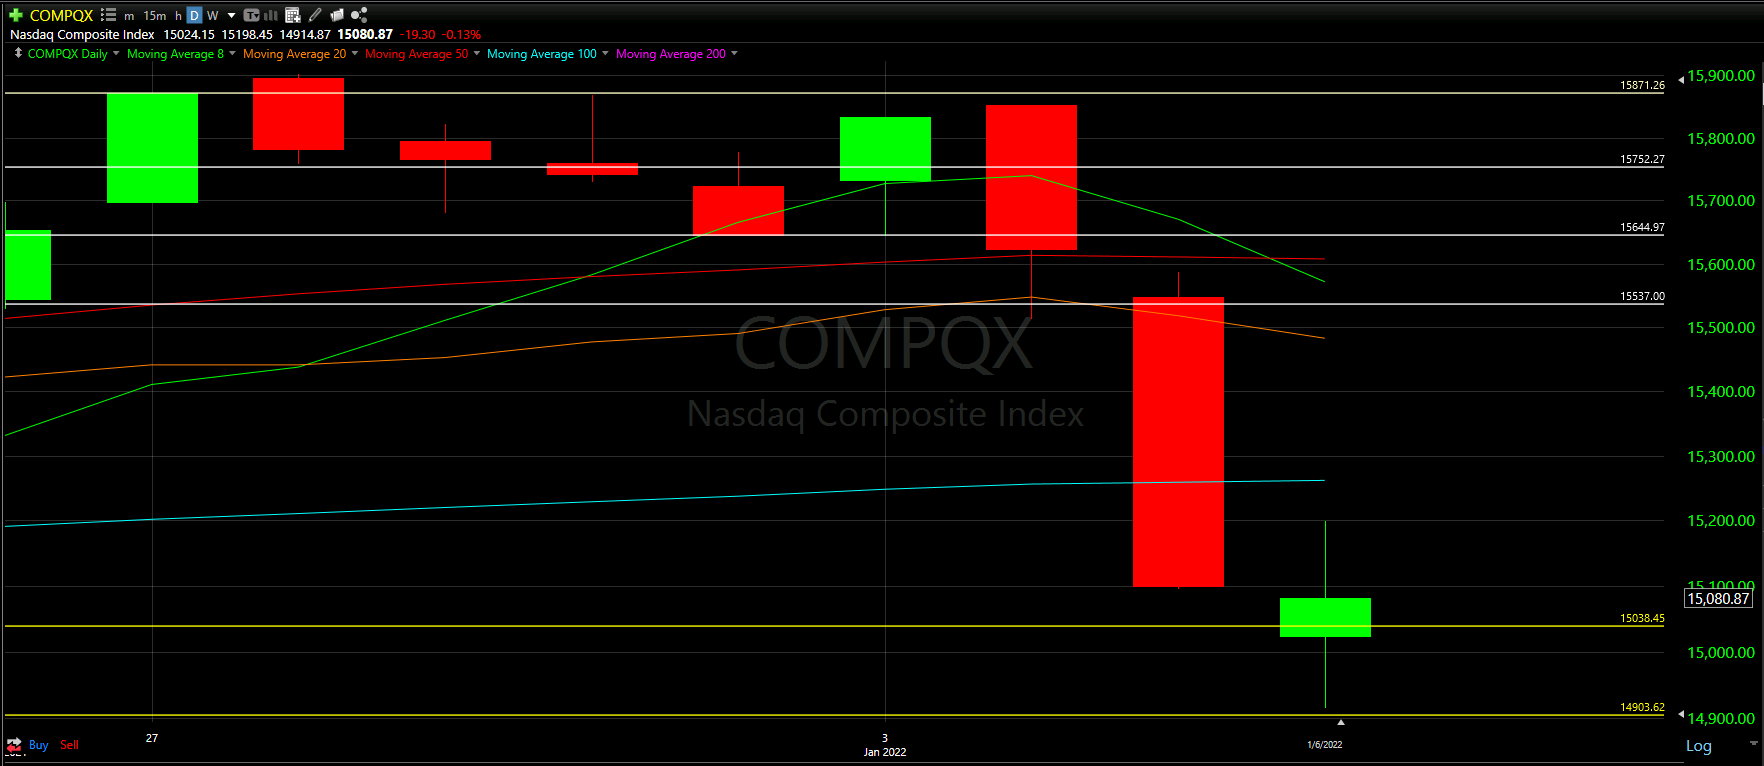
We talked about the dreidel-looking candle stick before, and we see another one today. There is clearly an extremely long wick on the top and bottom of the candle - showing uncertainty between traders today. Tomorrow will help to confirm the uncertainty - either a continued drop down or a rise up for a second positive day.
What is disappointing is that today’s candle never came close to 50% of yesterday’s candle. Even the peak of the wick on top was nothing more than 25% of yesterday’s massive red candle.
From there, it looks like our new Support line in yellow was right on as this was the ultimate starting point for the day, give or take. Additionally, the bottom wick almost went as low as our 2nd Support line too. Not too shabby!
Remember, Support lines do not need to be 100% accurate to help gauge what the day may bring!!
Bottom Half Analysis
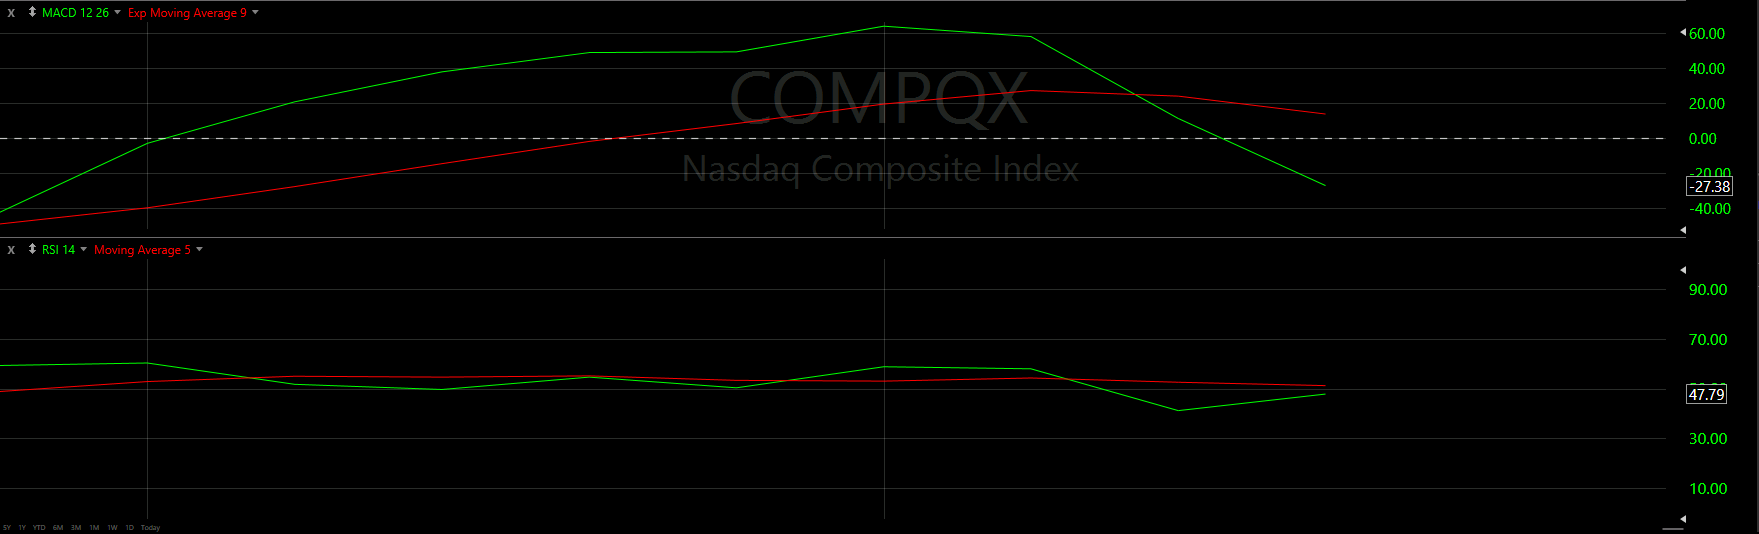
There seems to be a mixed signal in the momentum readings of the MACD and the RSI. Let us take a deeper dive.
Starting with the MACD, yesterday’s cross under the Red line continues and seems to be dropping steadily. This is extremely negative and there does not seem to be much of a stop in sight. Ideally we get some good movement and the Green line starts to show a chance of getting back over the Red line.
On the other hand, the RSI is starting to show some recovery with the rather unexpected incline up. It seems there has been a tight back and forth between the Green and Red line in the RSI; however, this was one of the bigger momentary drops. Keep in mind, we are still under the Red, so as nice as the incline is to see, we have made no recovery just yet!
Unfortunately, the momentum continues to be shifting in the wrong direction for the NASDAQ, but it seems a good day tomorrow can neutralize some of the shift.

Hourly Analysis
The Hourly chart above really seems to be a bounce between our new Support line and the 8 Moving Average.
The day starts just under our line and tries to climb up and over the 8 Moving Average for the next few hours. The NASDAQ actually closes above the 8 Moving Average on the 6th hour; however, we crash back down at the last hour before the closing bell.
The MACD and RSI are both showing the Red line over the Green line and it seems both want to continue to drop. We may have a tough start to the day, but ideally, we get some help during the rest of the day.
Final Thoughts and Targets
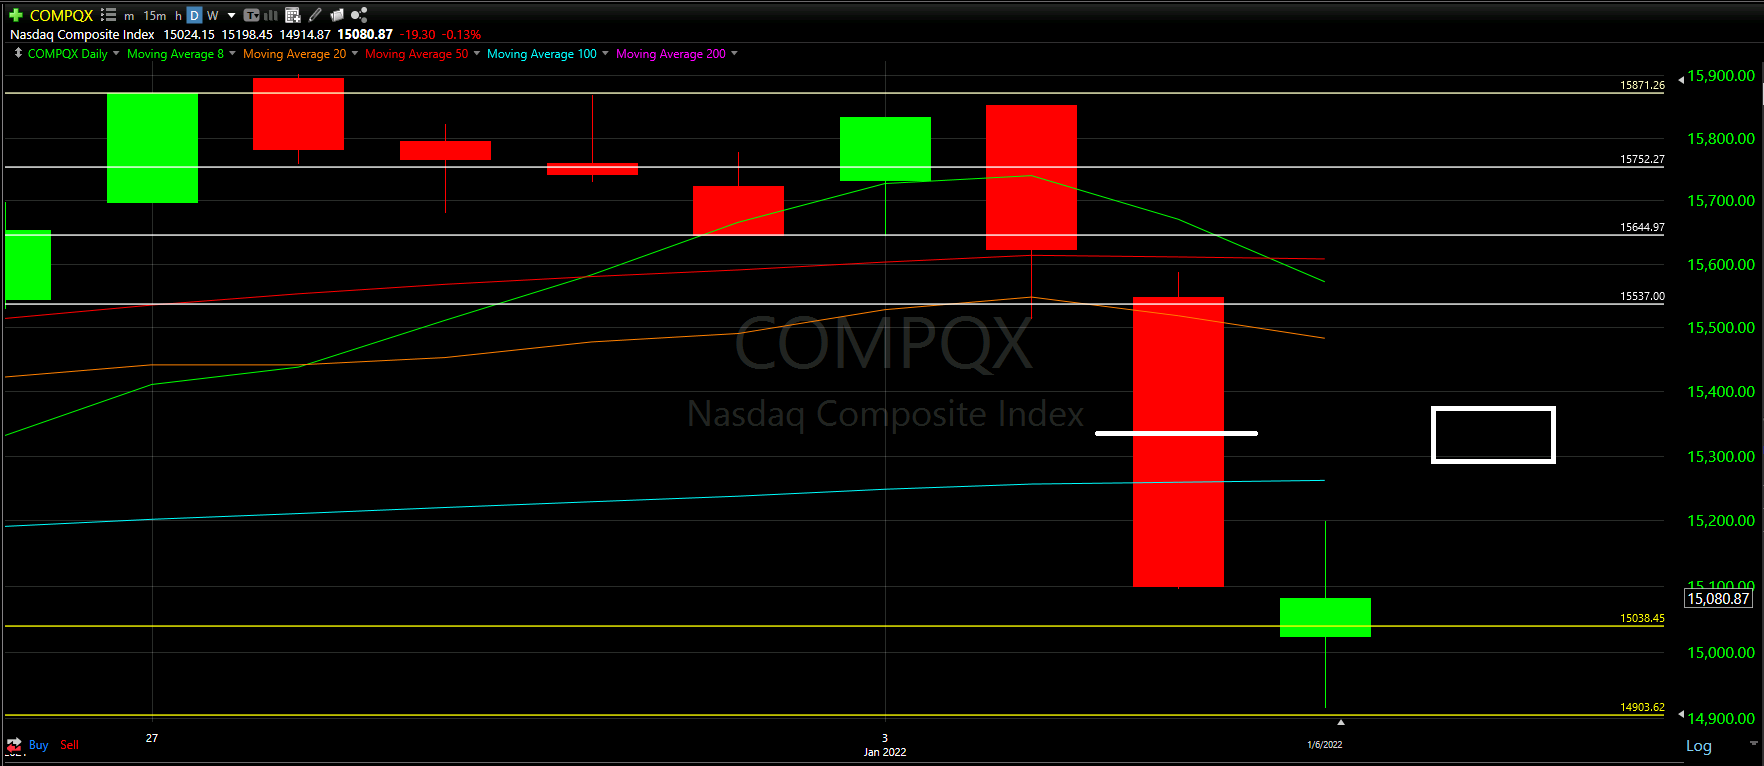
There are some signs that we may actually get another positive day tomorrow in the NASDAQ; however, nothing will matter until we get over at least 50% of the giant red candle above - roughly where the white line is drawn. Until we get a candle near the White Rectangle, there is still a lot to be worried about for tech in general.
Good luck trading!