January 10th Recap and 11th Predictions
What to Expect
With the sixth trading day of January completed, let us see how the day played out and what to expect tomorrow.
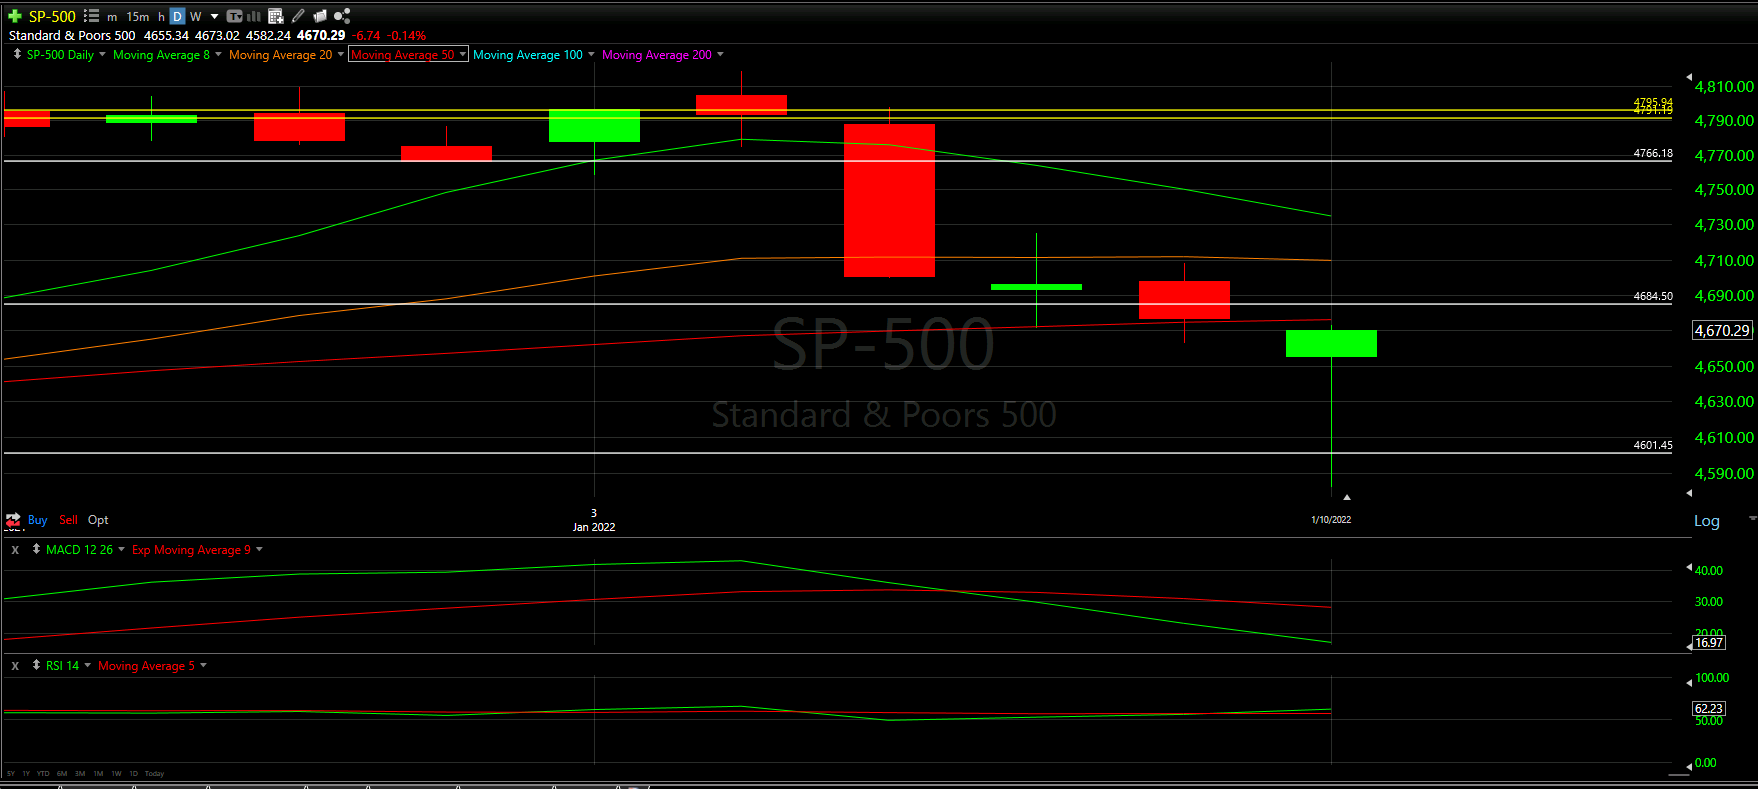
Above you will see the full view of the Daily chart; Top and Bottom indicators included.
As always, we will start by analyzing the Top Half of the Daily chart; seeing how our horizontal Support and Resistance Lines played out during the day, reviewing the Moving Averages that came into play as well as comparing previous candles
From there, we will analyze the Bottom Half of the Daily chart to see what the momentum looks like going into tomorrow with the additional MACD and RSI indicators.
Ultimately, we will use the combined data to help anticipate the movement of the S&P-500 for tomorrow.
Top Half Analysis
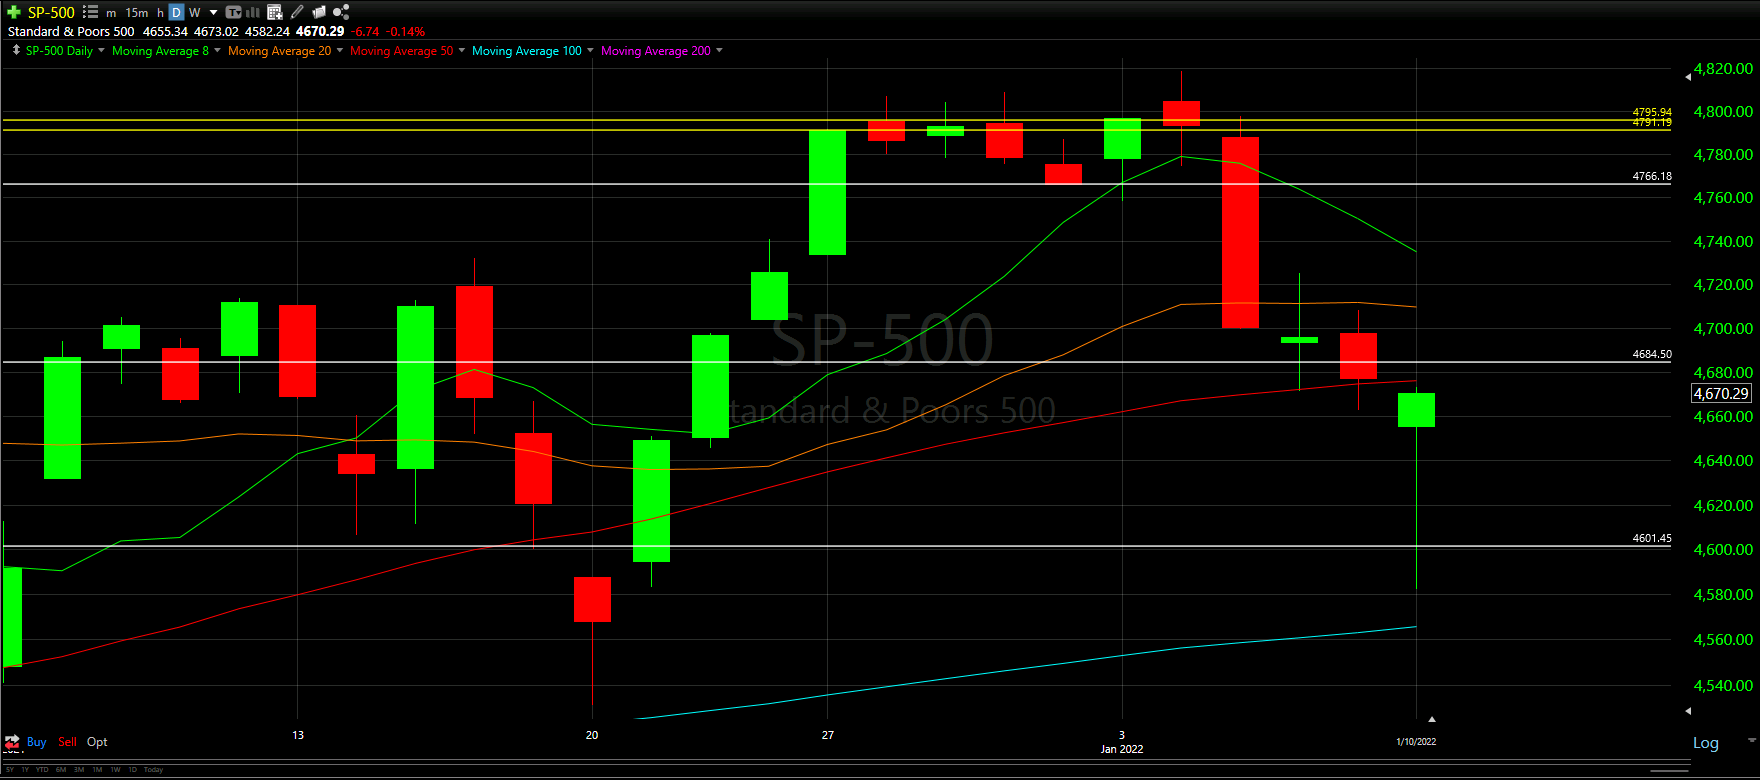
The Dow Jones, NASDAQ, and S&P-500 all had the same extremely long wick that is seen on today’s candle above. The S&P-500 seemed to have the hardest drop (or longest wick) before the ultimate recovery where it closed. This will show itself more when we look at the Hourly chart below.
Unfortunately, the daily recovery was not enough to close above a few key milestones we wanted to hit.
Starting with the Moving Averages, clearly we are below 3 of the 4 in the screenshot above. It looked like there was a chance to reach the 50 Moving Average; however, as the chart shows, we never hit the line.
There also seems to be a convergence with the Moving Averages at the top of the chart - the 8, 20 and 50 Moving Averages. The 8 Moving Average is clearly coming down at a hard slope, seemingly going to cross under the higher lines - something actually called The Death Cross.
Cross up is always better than Crossing down for Moving Averages, so this will be something important to watch.
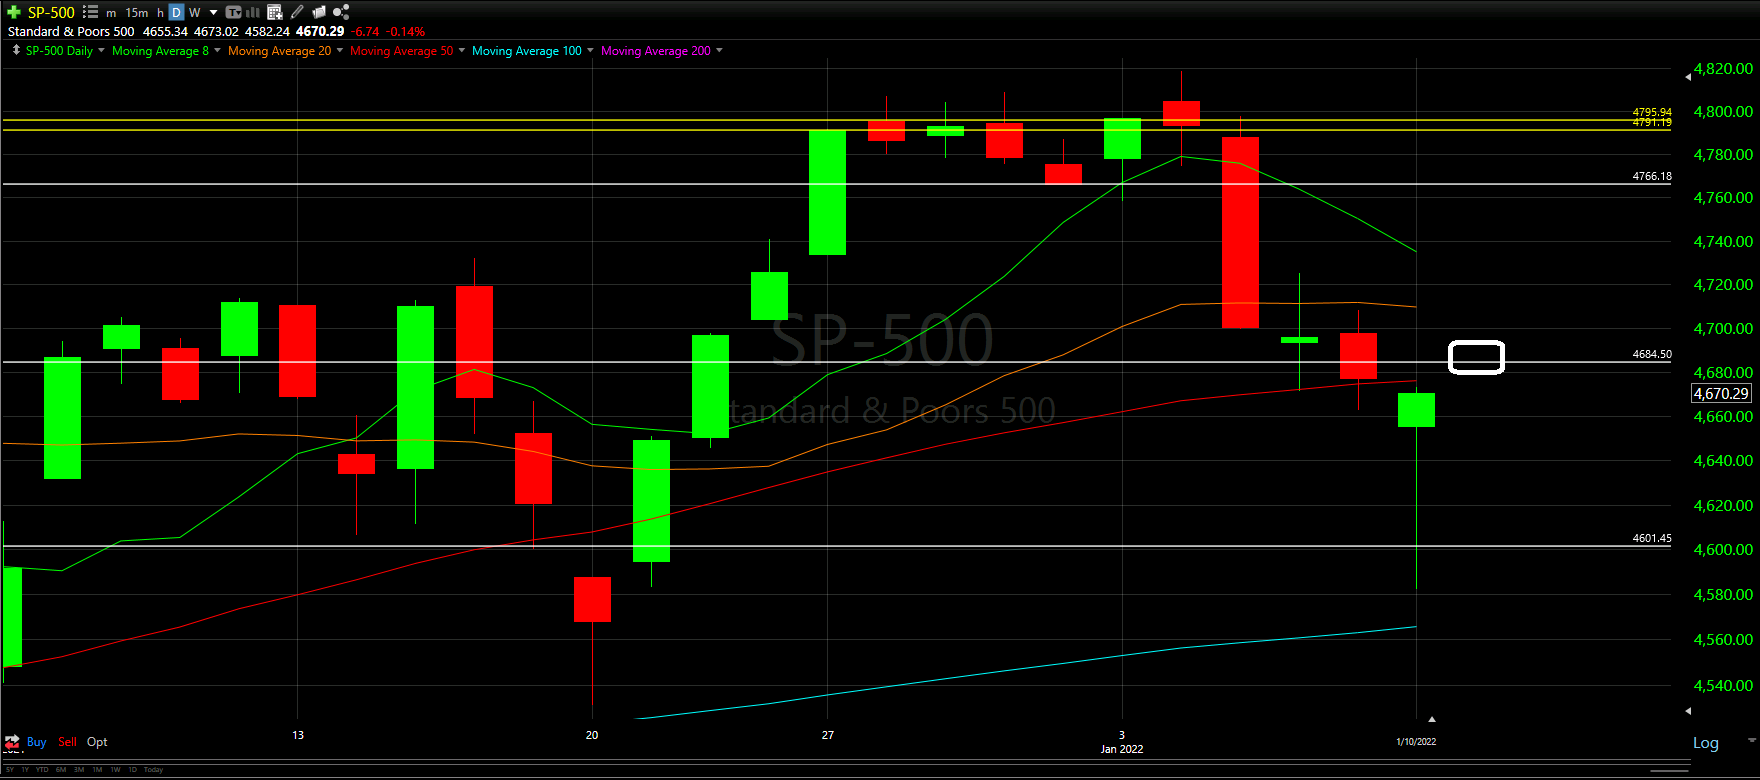
Lastly, it seems we are close to the Support Line in the middle of the image above; however, we are still closing under that line for 2 consecutive trading days. Ideally tomorrow we can get over that line and start to reclaim the Moving Averages as well.
Bottom Half Analysis
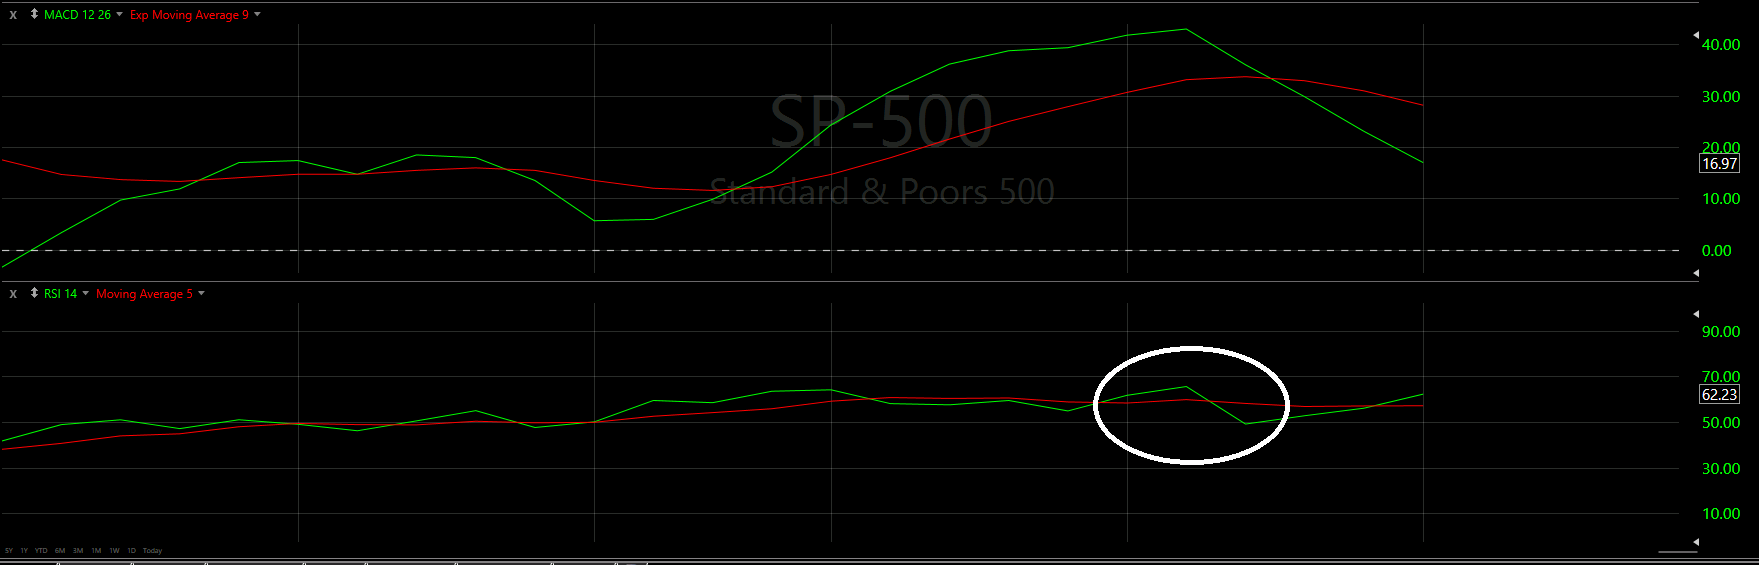
The Bottom Half analysis of the S&P-500 is almost identical to the NASDAQ with mixed signal in the momentum readings of the MACD and the RSI - just as we saw with the Dow Jones and NASAQ.
Starting with the MACD, the Green line continues to stay under the Red line with a consistent drop. Unlike other Major Markets, the S&P-500 does not seem to be starting to curve up. We really need another positive day to get this Green line moving in a better direction!
On the other hand, the RSI is maintaining the signs of recovery with the rather sharp incline in the Green line. It seems the Green line wants to create some seperation from the red line that has been flat.
The main hesitation with the postivity from the RSI is the fact that not too long ago we saw the Green line start to climb over the Red line before it quickly dropped - circled above in white. We are now recovering from that hard drop, but that could easily be a fake-out.
Hourly Analysis

Continuing with the corrolation between the Major Markets, the S&P-500 also had a horrible first two trading hours of the day.
Here it seemed our Support line was the bounce factor for the hourly chart above.
Just like the Dow and NASDAQ, the S&P-500 was able to close strong at the end of the day, with the consistent green candles at the end.
The exact positive/negative scenario we saw with the NASDAQ occurred in the final hour of the chart above. We were able to close above the 8 Moving Average but failed to get over the 20 Moving Average (closing pretty much right under the line). Closing above the 8 Moving Average is always a very good sign; however the 20 Moving Average is no picnic to get over. If we do not see a strong start to the morning, it could go downhill quickly.
Final Thoughts and Targets
Unfortunately, there are more worry signs for the S&P-500 tomorrow than there are for the NASDAQ and Dow Jones.
As great at it was to see the day end well above the lows of the bottom of the candle’s wick, the MACD and potential Death Cross of the 8 Moving Average under the 20 and 50 Moving Averages, we badly need one more positive day for the S&P-500.
Otherwise, there is a high probability we drop and potentially test the 100 Moving Average at the bottom of the chart
Good luck trading!