January 11th Recap and 12th Predictions
What to Expect in the Analysis Below
With the seventh trading day of January completed, let us see how the day played out and what to expect tomorrow.
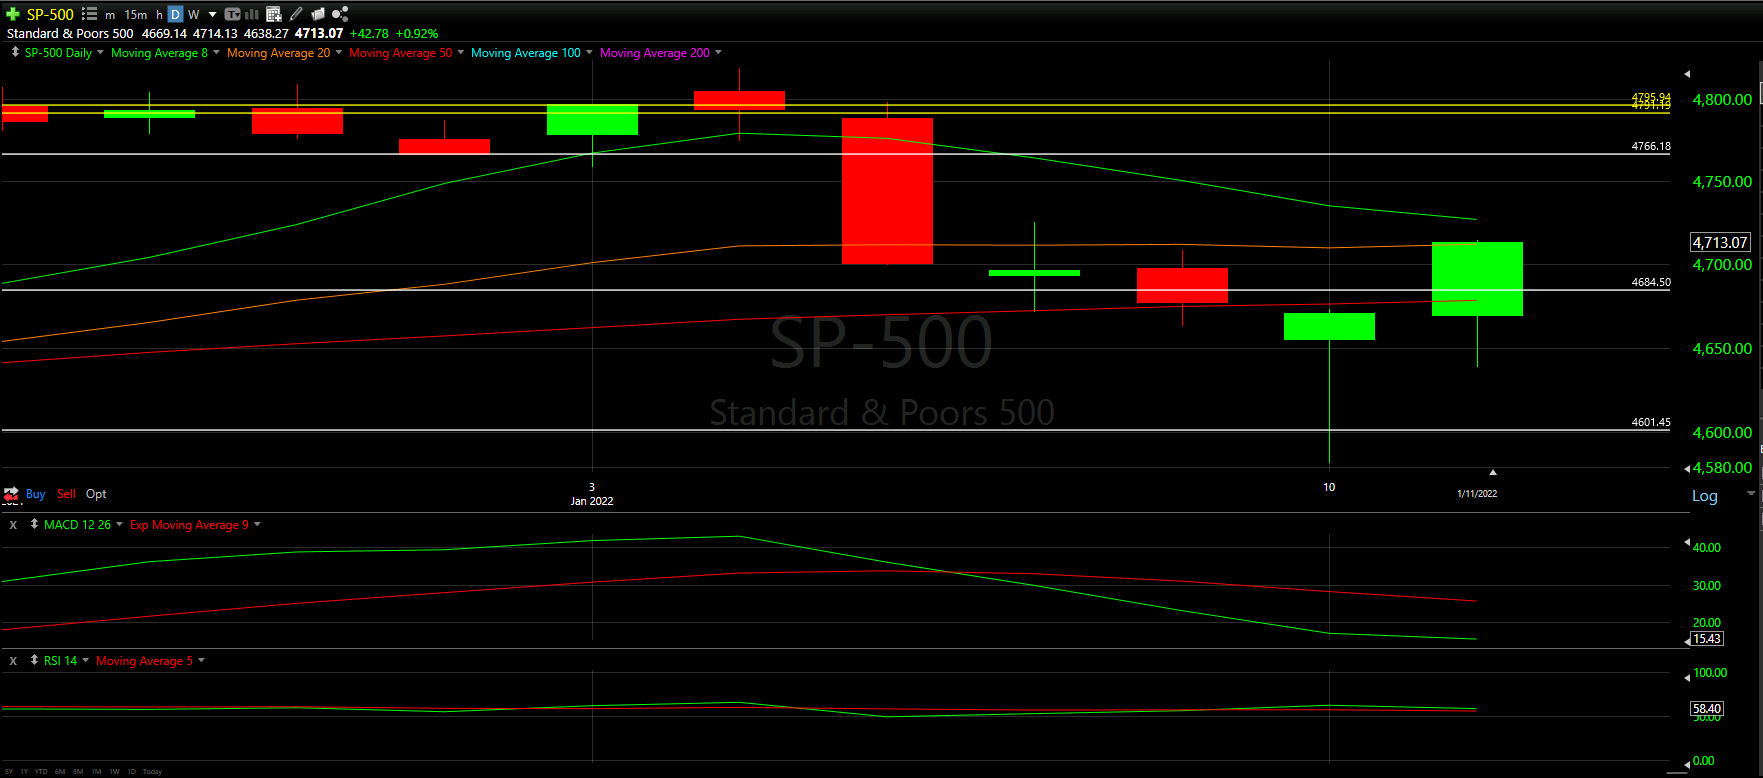
Above you will see the full view of the Daily chart; Top and Bottom indicators included.
As always, we will start by analyzing the Top Half of the Daily chart; seeing how our horizontal Support and Resistance Lines played out during the day, reviewing the Moving Averages that came into play as well as comparing previous candles
From there, we will analyze the Bottom Half of the Daily chart to see what the momentum looks like going into tomorrow with the additional MACD and RSI indicators.
Ultimately, we will use the combined data to help predict the movement of the S&P-500 for tomorrow.
Top Half Analysis
It is always good when there are correlations (or similarities) between the Major Markets. You will see that today’s Top Half Analysis of the Dow Jones was very similar to the S&P-500.
Ironically, the S&P-500 had a much better day than we were anticipating yesterday.
There was a modest wick at the bottom of the candle, so it was nice that most of the day was in the green.
More so, we can see that today’s close was above the 20 Moving Average, 50 Moving Average, and one of our Support lines! Talk about making up some ground in a single day!!
Just as we have said with the Dow Jones and NASDAQ, we really need one more day of confirmation to help us solidify this positive feeling.
It seems all of the Major markets are looking to break the recent downtrend and work their way back up.
Bottom Half Analysis

All 3 of the Major Markets had a discrepancy between the MACD and RSI lines.
The MACD appears to show the Green line starting a curl up, with hopes of surpassing the Red line in the coming days. The Green line was in a horrible downward slope all last week, so it is nice to see this curl.
The RSI; however, is trending down though the last days have been positive. We have echoed the potential worry this shows because it may be difficult to keep an upward trend with low momentum from the RSI.
None the less, let us hope the MACD is the indicator that matters more here.
One more day hopefully will clear up the picture.
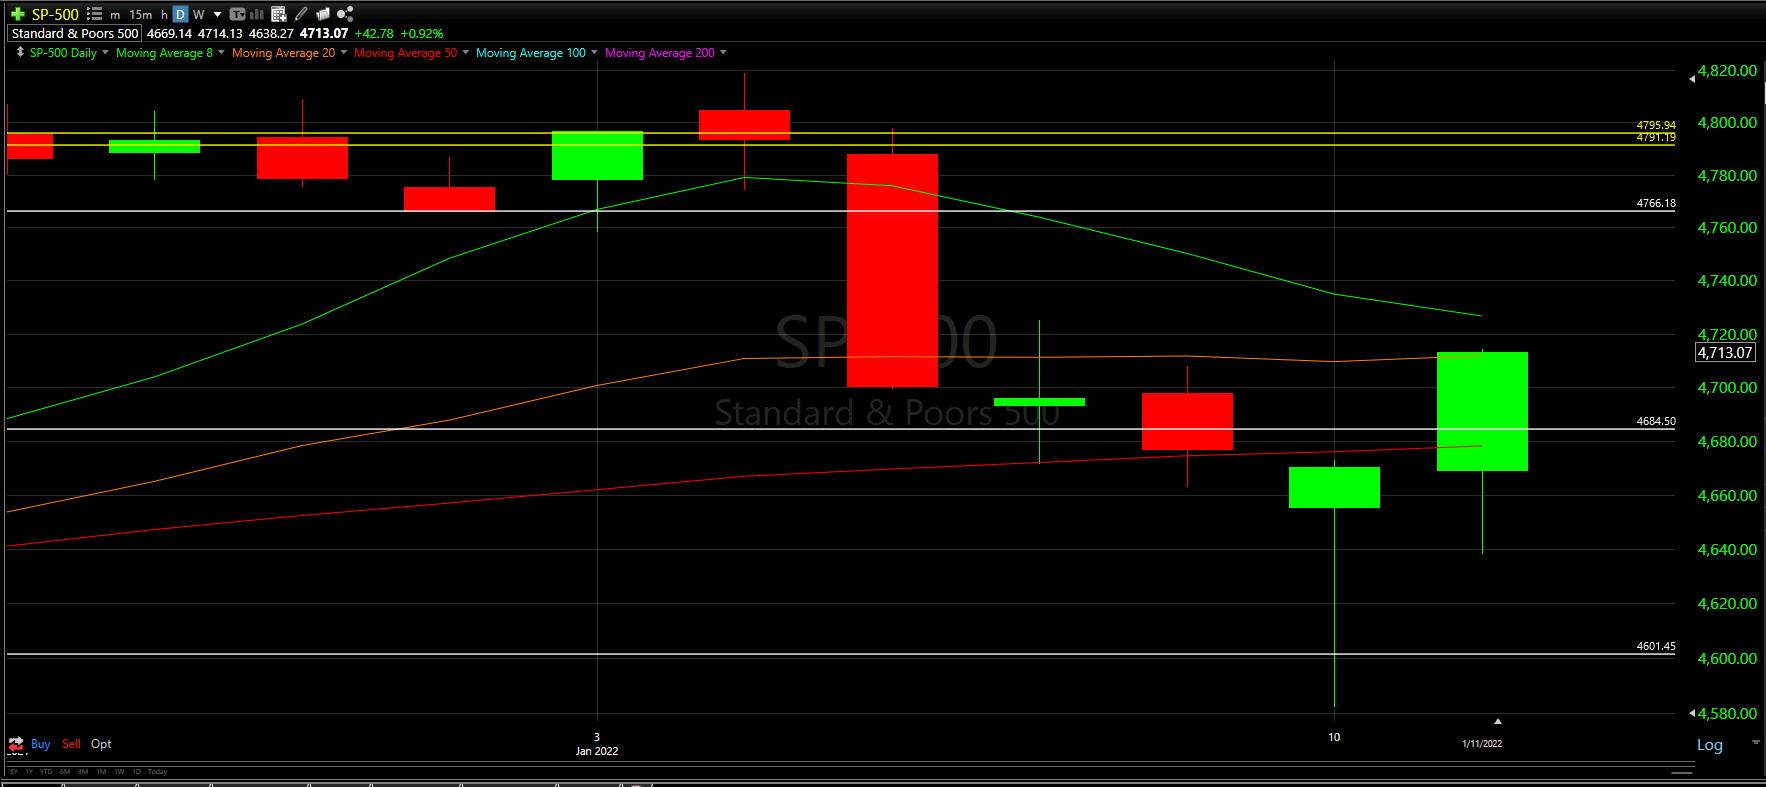
Hourly Analysis

To quote Borat, “Wow eh Wow Wow!”
The first hour was clearly a loser - starting at the 20 Moving Average and working down from there.
However, it seems the 8 Moving Average was just below and really help guide the rest of the hours us. Not a single hour went below the 8 Moving Average, which looked to have a sharp 45-degree slope up the chart.
Just as we mentioned yesterday, ideally this hourly chart helps to kick off a good morning for the S&P-500
Final Thoughts and Targets

There is more optimism than fear in the S&P-500 Daily and Hourly chart analysis; however, the RSI indicator seemed to be a rather odd outlier.
If the day goes well, the goal will be to close at or above the 8 Moving Average line - marked by the white square above. We just closed above the 20 Moving Average so ideally, the 8 Moving Average is next
The worst thing that could happen is we lose more than 50% of today’s candle and continue a downtrend. That would also mean losing the 20 Moving Average we just closed above today.
Here is hoping we curve upward!
Good luck trading!
Don’t forget to check out the Free Knowledge Center to refresh the basics or learn more about Technical or Fundamental Analysis