January 6th Recap and 7th Predictions
What to Expect
With the fourth trading day of January completed, let us see how the day played out and what to expect tomorrow.
As we will always do, the first thing to be reviewed will be Top Half of the Daily chart. We will see how the horizontal Support and Resistance Lines from our January Monthly Prediction played out during the first day, as well as review the Moving Averages that came into play.
From there, we will look at the Bottom Half of the Daily chart to see what the momentum looks like going into tomorrow with the additional MACD and RSI indicators.
Top Half Analysis
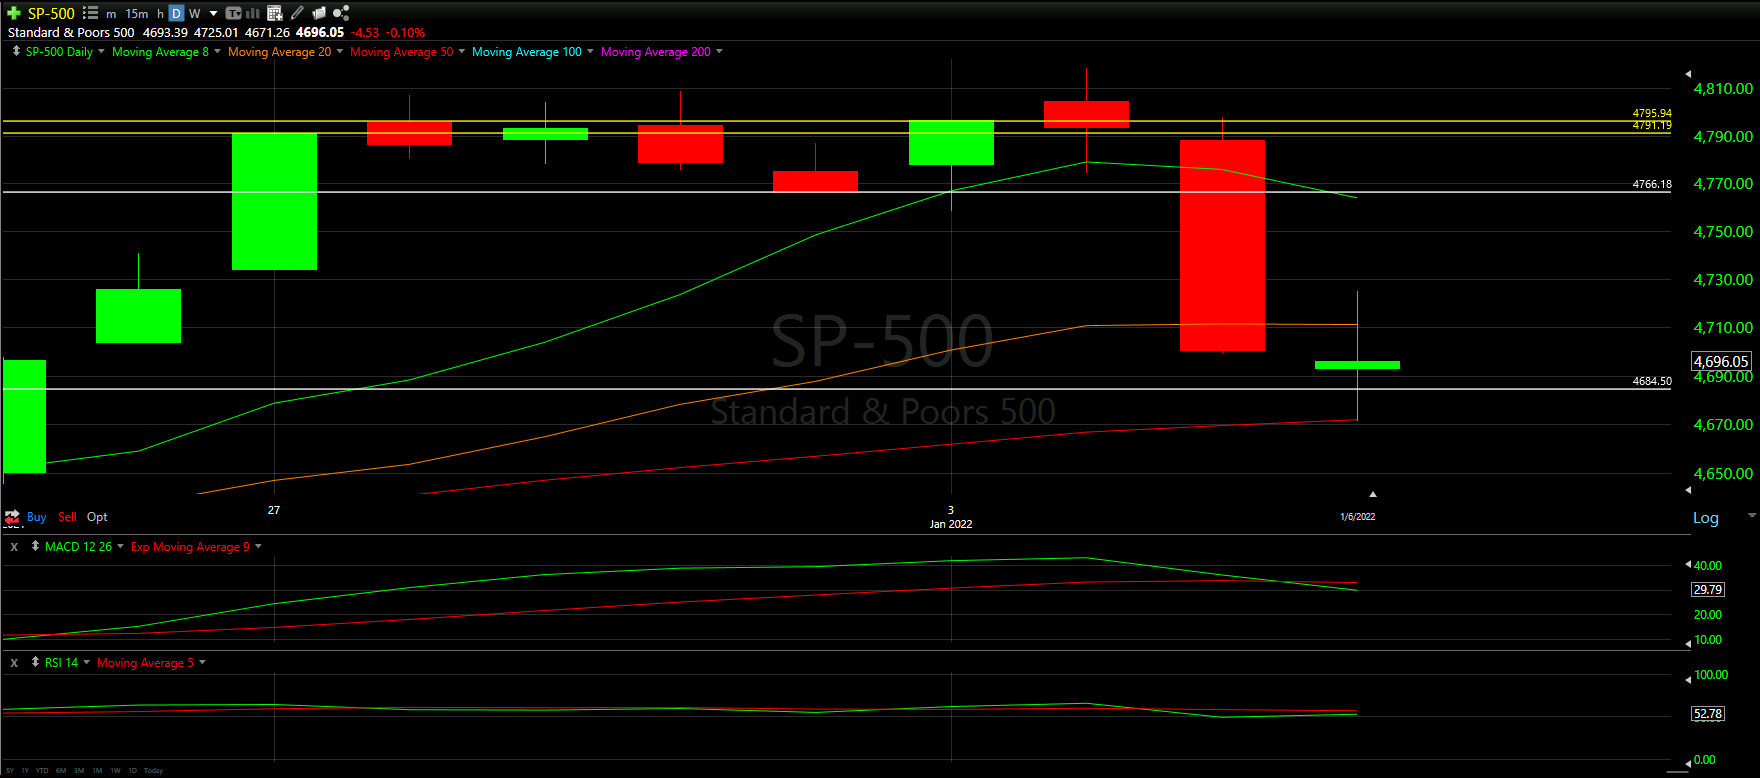
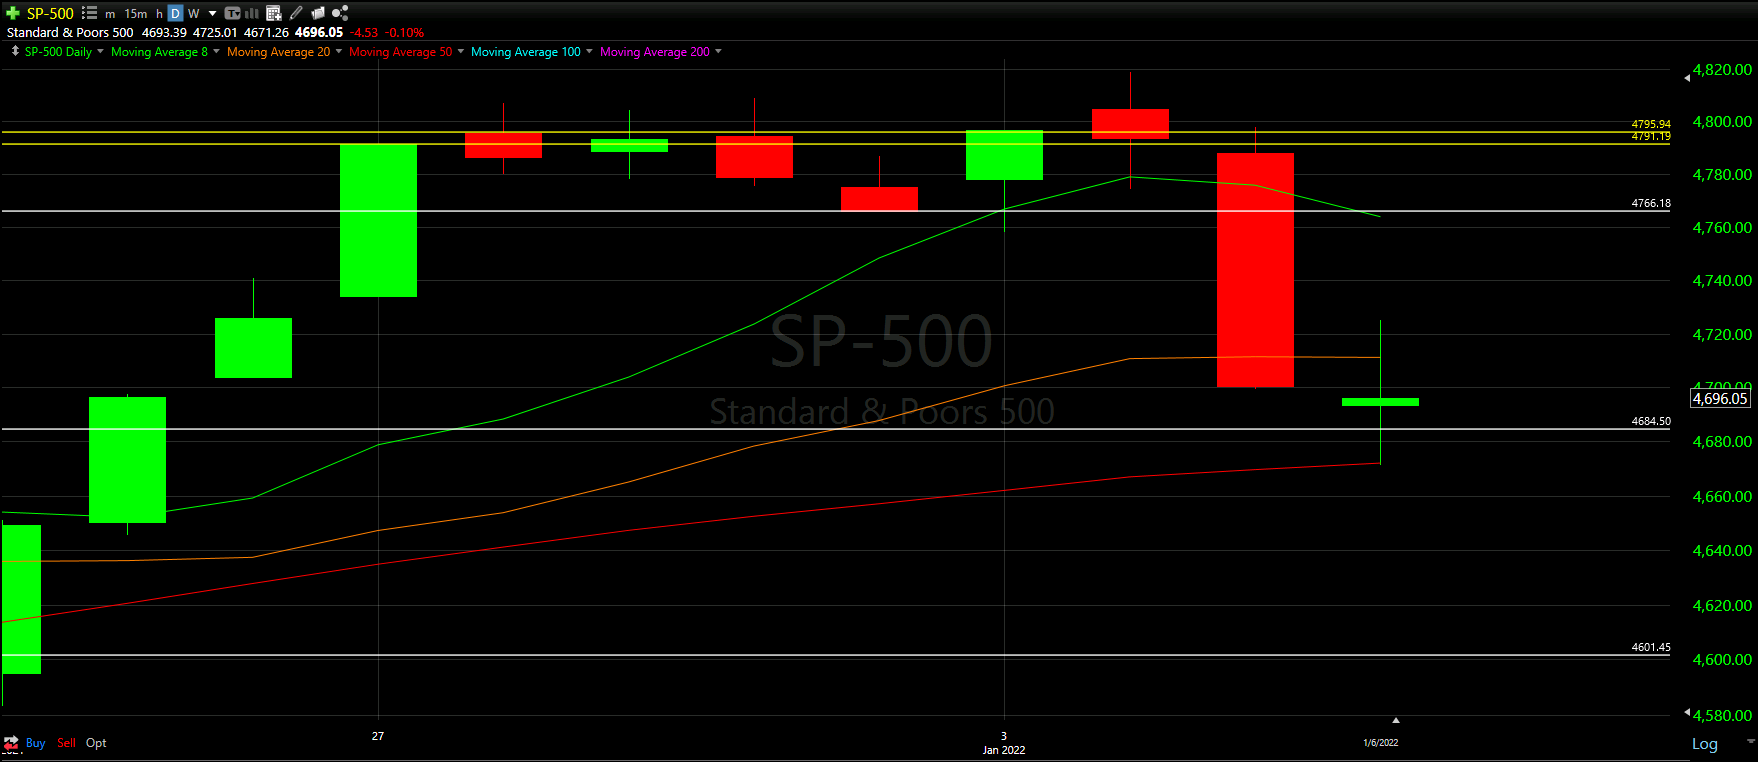
2 of the 3 Major Markets closed the day with the dreidel-looking candle, marking a sign of uncertainty.
Above, we see today had this dreidel-looking candle with the extremely high wicks on the top and bottom of the candle. Just as we saw, the top of the wick does not come anywhere near 50% of yesterday’s candle.
It is somewhat positive to see that the candle was actually able to start and end over our Support line. It seems that line was able to hold the drop by at least a day. The next important question becomes: can we bounce up from here?
We continue to trade below both the 8 and 20 Moving Averages, and clearly, the bottom wick actually came down to the 50 Moving Average.
Ideally the combination of the 50 Moving Average and the Support line in white are enough to help up bounce up. Good momentum will be important to complete that task.
Bottom Half Analysis
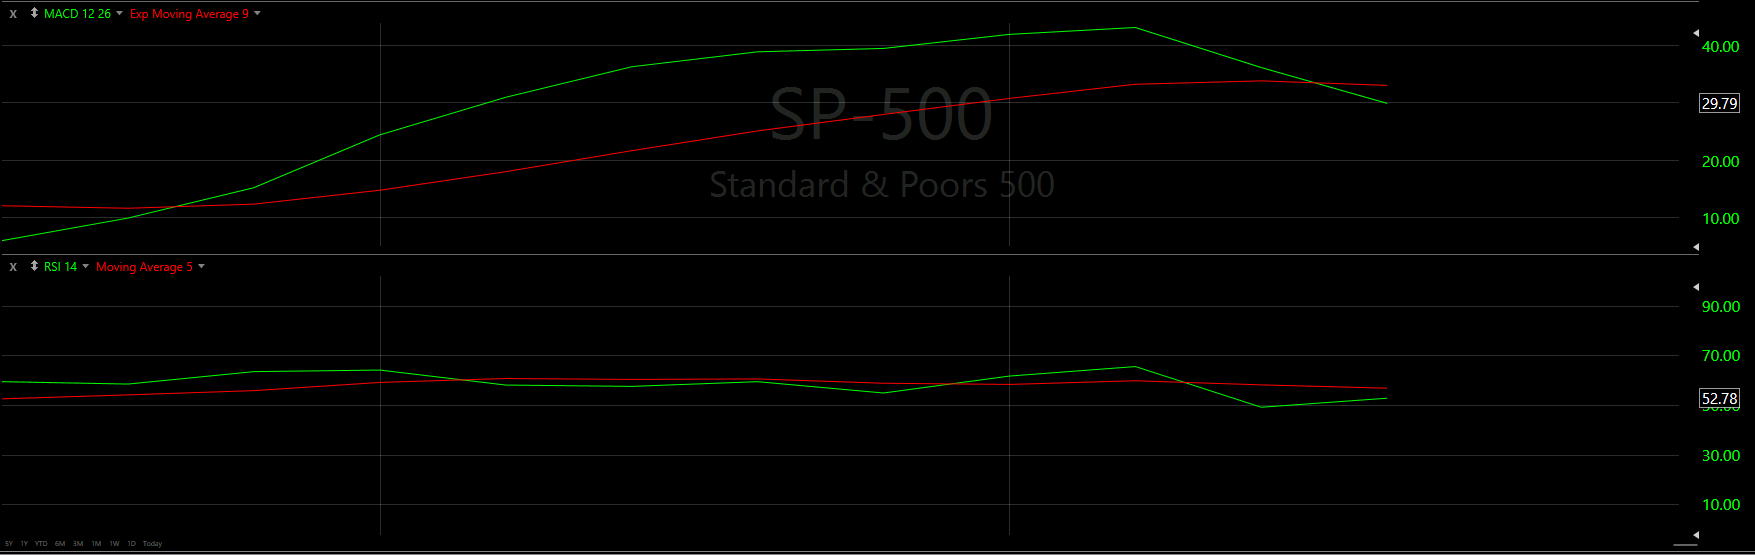
The Bottom Half analysis of the S&P-500 is almost identical to the NASDAQ with mixed signal in the momentum readings of the MACD and the RSI.
Starting with the MACD, yesterday’s cross under the Red line continues and seems to be dropping steadily. This is extremely negative and there does not seem to be much of a stop in sight. Ideally we get some good movement and the Green line starts to show a chance of getting back over the Red line.
On the other hand, the RSI is starting to show some recovery with the rather unexpected incline up. It seems there has been a tight back and forth between the Green and Red line in the RSI; however, this was one of the bigger momentary drops. Keep in mind, we are still under the Red, so as nice as the incline is to see, we have made no recovery just yet!
Unfortunately, the momentum continues to be shifting in the wrong direction for the S&P-500, but it seems a good day tomorrow can neutralize some of the shift.

Hourly Analysis
The Hourly chart above really seems to be a bounce between our new Support line and the 8 Moving Average.
The day starts just over our Support line and tries to climb up and over the 8 Moving Average for the next few hours. The S&P-500 actually closes above the 8 Moving Average on the 6th hour; however, we crash back down at the last hour before the closing bell. This was the exact hourly trend as the NASDAQ
The MACD and RSI are both showing the Red line over the Green line and it seems both want to continue to drop. We may have a tough start to the day, but ideally, we get some help during the rest of the day.
Final Thoughts and Targets
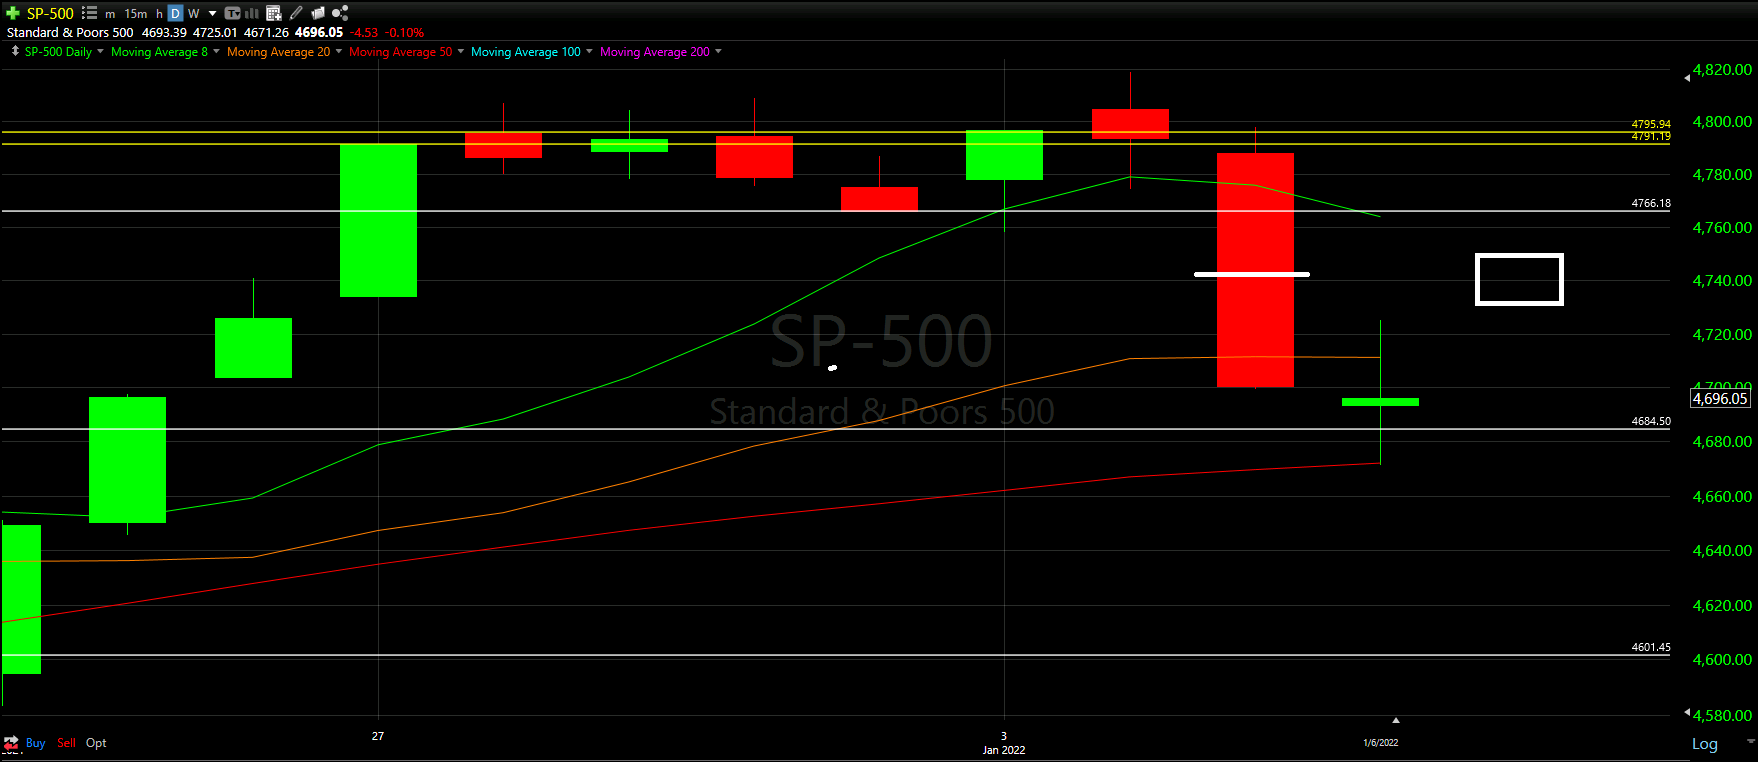
Similar to the NASDAQ, there is a chance we actually get a second positive day in a row. However, it will not matter unless we are able to get up to at least 50% of yesterday’s large red candle. That would put us near the white rectangle around $4,740. Otherwise, we may just have a small fake-out up before continuing the downtrend.
Good luck trading!