January 4th Recap and 5th Predictions

What to Expect
With the second trading day of January completed, let us see how the day played out and what to expect tomorrow.
As we will always do, the first thing to be reviewed will be Top Half of the Daily chart. We will see how the horizontal Support and Resistance Lines from our January Monthly Prediction played out during the first day, as well as review the Moving Averages that came into play.
From there, we will look at the Bottom Half of the Daily chart to see what the momentum looks like going into tomorrow with the additional MACD and RSI indicators.
Overall, what we expected seemed to have played out as we will see below:
Top Half Analysis
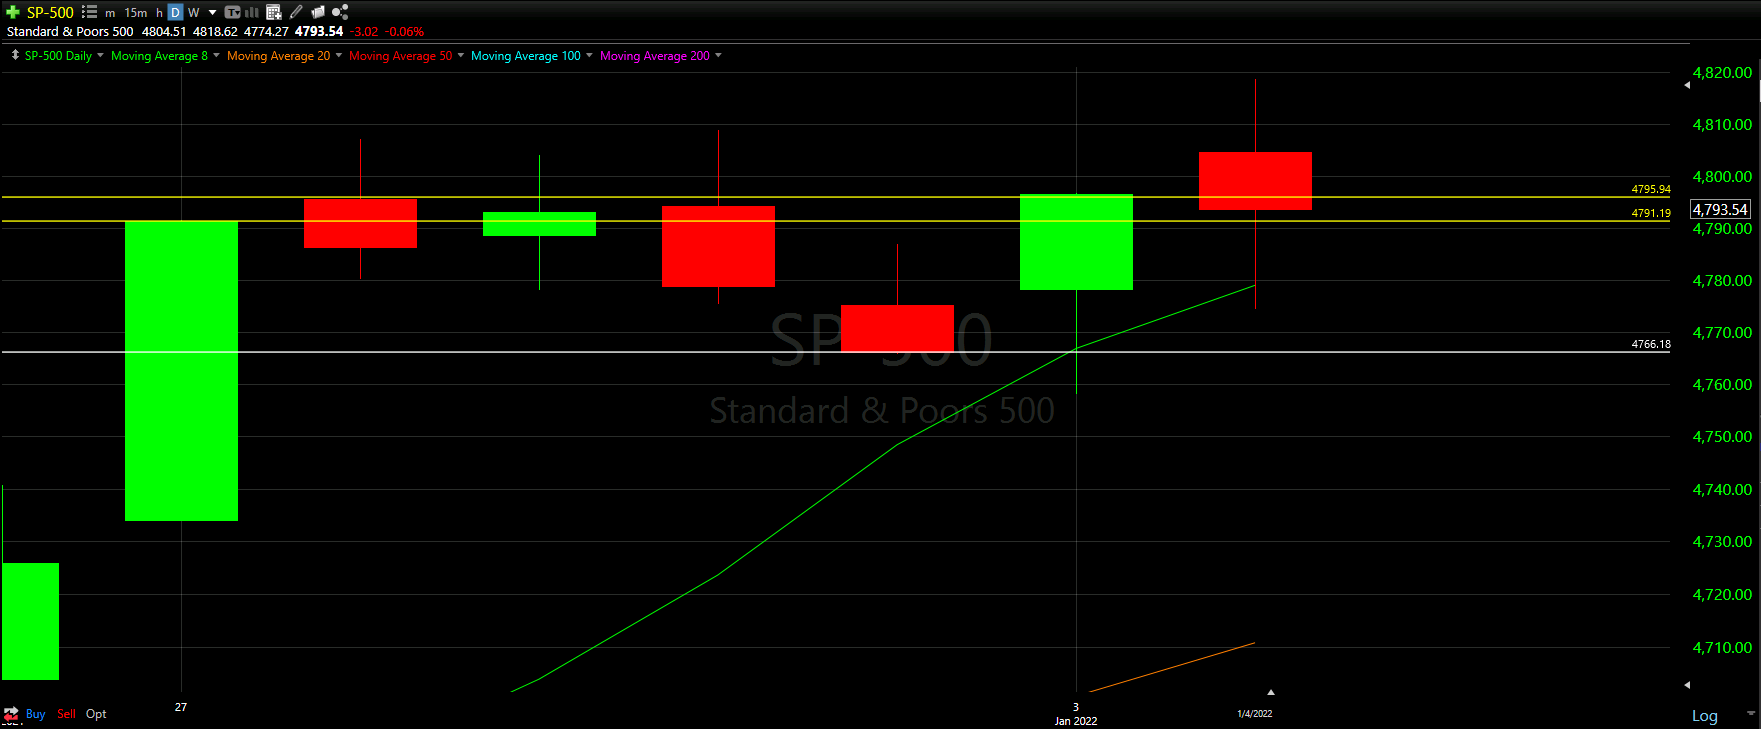
The S&P-500 performed as we predicted yesterday; however, there seems to be some uncertainty in the trading day.
As we wanted, the candle was able to close above 1 of 2 new Support lines created yesterday in yellow. Ideally the day would have closed over both, but at least we held one of the Supports!
That said, there looks to be fairly extreme wicks on the top and bottom of the day’s candle. This shows that at one point in the day, the S&P-500 wanted to skyrocket as well tank - we will look at that more in the Hourly Analysis below.
It is positive to see that we were able to close the day above 50% of yesterday’s candle as well as well over the 8 Moving Average. However, the uncertainty shown from the day’s candle should be taken with caution - especially with the bad trading day we saw with the NASDAQ
Overall, the Top Half technical analysis of the S&P-500 has been rather inconclusive. Too many elements of good and bad to make this anything more concrete. Let us see what the Bottom Half technical analysis says about the momentum.
Bottom Half Analysis
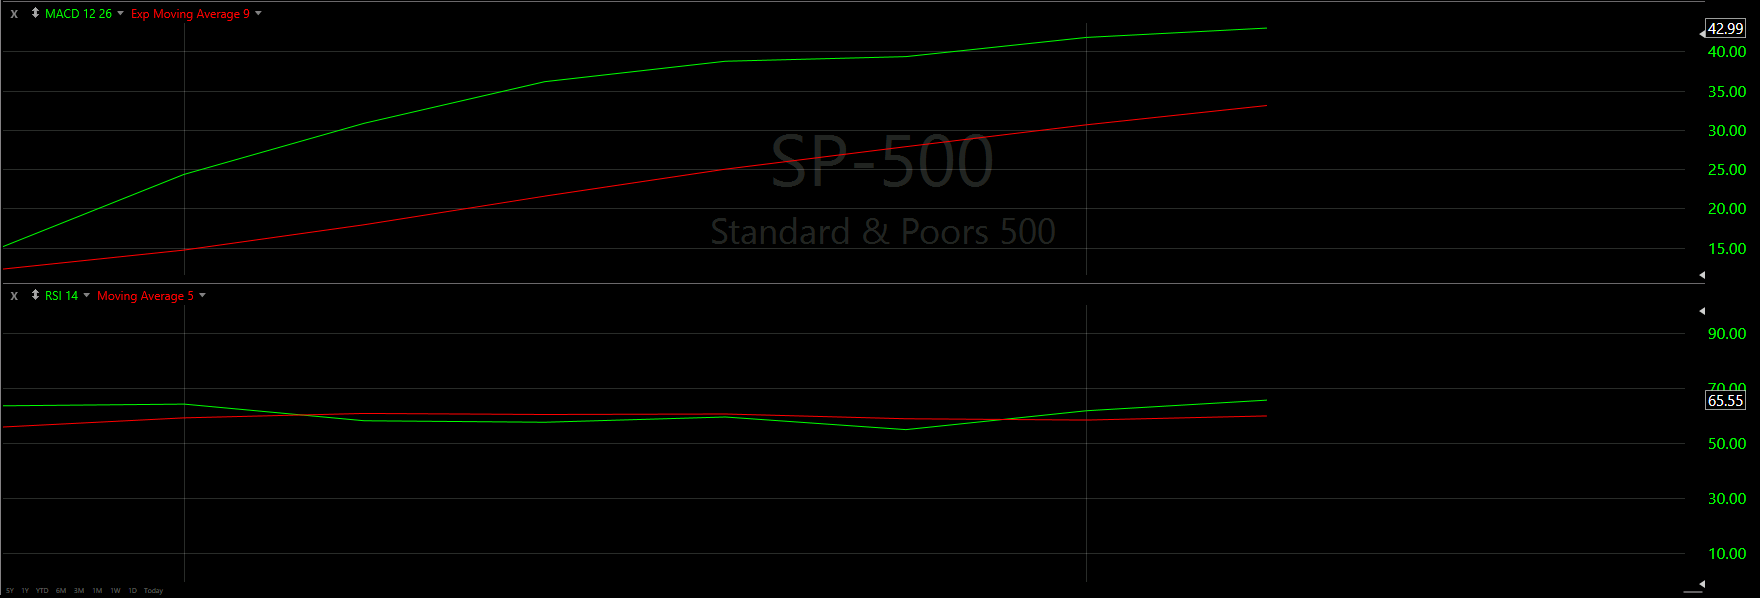
Starting with the MACD, it seems the MACD held up better than the Dow Jones and NASDAQ did today. There is no prominent decline in the green line - almost staying completely flat from to yesterday
Additionally, it seems the RSI is actually doing the same thing as the MACD. There seems to be a flatness to the movement when compared to yesterday.
Overall, it seems the momentum is relatively inconclusive as well.

Hourly Analysis
With a solid view of the daily chart, let us look at each of the day’s trading hours between 9:30 a.m. to 4 p.m. ET, or the 7 candles above.
The first hour seemed rather positive, with a nice gap up from yesterday’s candle and not too extreme a wick on top. However, the second hour - just like the NASDAQ - really brought most of the pain during the day.
From there, three following hours declined as well - losing our Support Lines and a number of Moving Averages.
Similar to the hour charts of the other Major Markets, the last 2 hours tried to bring some gains back in the day.
The last hour is a bit concerning given the extreme length of the wick on top. The last hour really tried to recover a lot of the day’s loses; however, something caused it to slam all the way down. Not a good way to end the day.

Final Thoughts and Targets
With the uncertainty of the day’s candle and the inconclusive analysis, it would seem that caution should be had with the S&P-500. By no means are we as conserned as we are with the NASDAQ Index; however, tomorrow should be a very telling day.
Best Case - we close somewhere in the white box area, above 50% of yesterday’s candle as well as over the 2 support lines
Worst Case - we close below the 2nd Support line and start to test the 8 Moving Average.
Good luck trading!